



Factors..5 min read
Factor crowding and decay
McLean and Pontiff found the median published anomaly kept 42 percent of its in sample alpha, which is why a brochure backtest and a live fund can sit nine points apart.
By Tanmay Kurtkoti, founder of QC Alpha and builder of RupeeCase
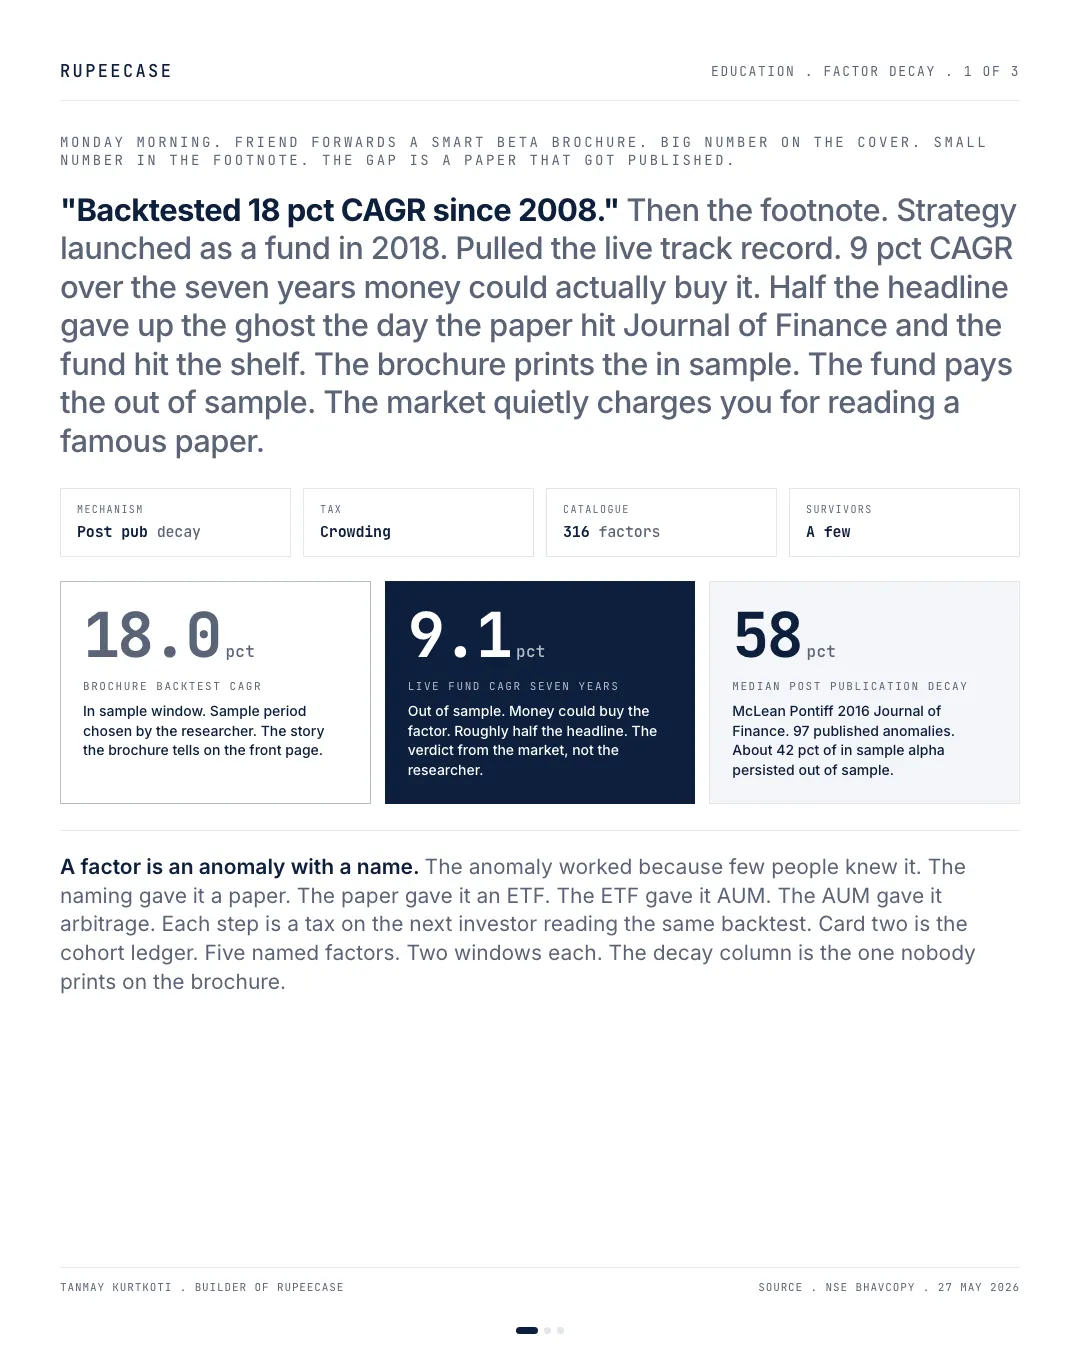
Monday morning. Friend forwards a smart beta brochure. Cover number "Backtested 18 pct CAGR since 2008." Small print at the bottom . the fund launched in 2018.
Pulled the live track record. 9 pct over the seven years money could actually buy it.
Half the headline gave up the ghost the day the academic paper got published and the ETF hit the shelf. The brochure prints the in sample. The fund pays the out of sample. The market quietly charges you the gap for reading a famous paper.
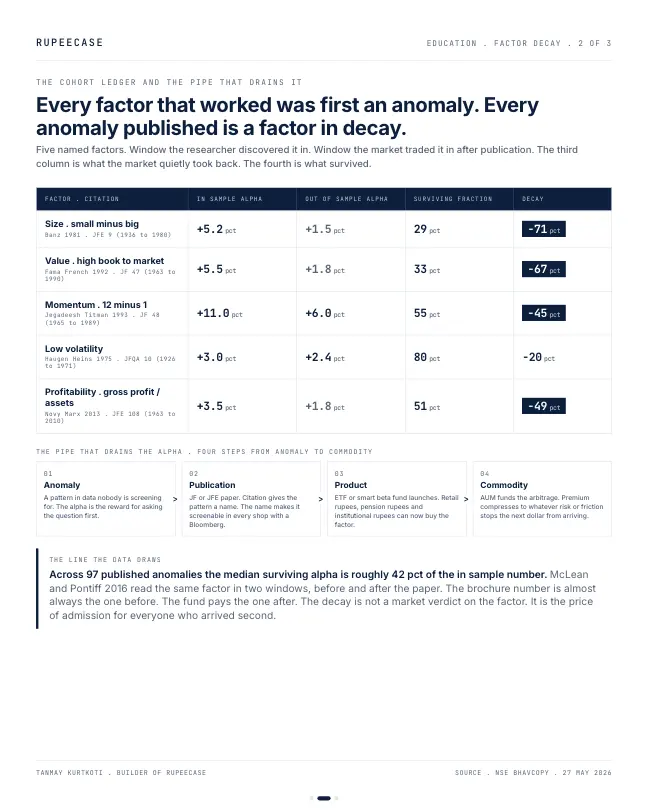
McLean and Pontiff 2016 Journal of Finance read 97 published anomalies in two windows, before and after the paper landed. Median surviving alpha was 42 pct of the in sample number. 58 pct of the brochure return walked.
Five named factors. Banz 1981 size lost roughly 71 pct of its premium after publication. Fama French 1992 value lost 67 pct, partly because the 2010s gave value a decade long sleep. Jegadeesh Titman 1993 momentum was sturdier at 45 pct decay. Novy Marx 2013 profitability gave back about half. The one that aged best is low volatility, published earliest, with the smallest crowd of imitators . roughly 20 pct decay.
The pipe runs anomaly to publication to product to commodity. The anomaly works because few people are looking. Publication gives the pattern a name and a citation that makes it screenable in every shop with a professional terminal. ETFs and smart beta funds open the gates to retail, pension, and institutional rupees. AUM funds the arbitrage. The premium compresses to whatever friction keeps the next dollar out.
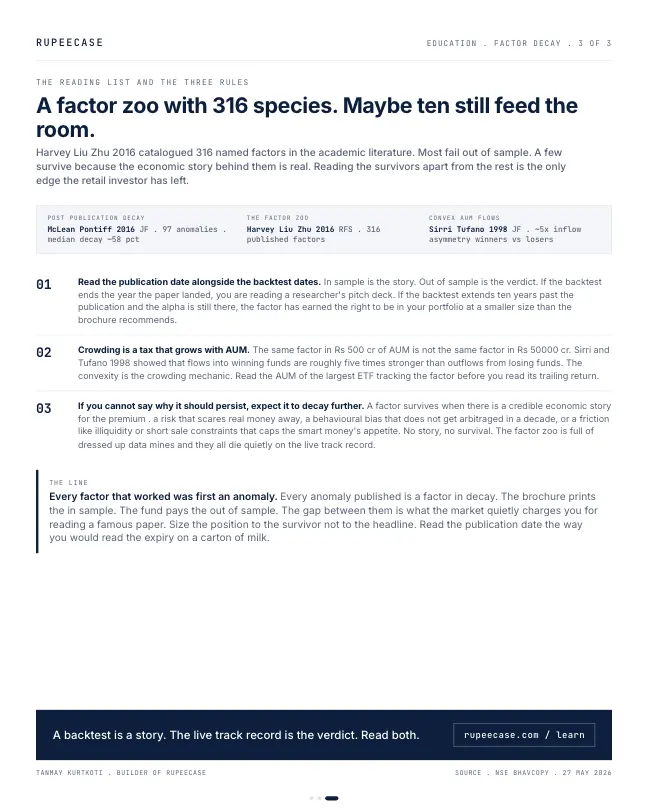
Three rules I keep coming back to. Read the publication date alongside the backtest dates. Price the crowding . the same factor in Rs 50,000 cr of AUM is not the same factor in Rs 500 cr. If you cannot say why the factor should persist, expect it to decay further.
Every factor that worked was first an anomaly. Every anomaly published is a factor in decay. Read the publication date the way you would read the expiry on a carton of milk
What the gap costs in rupees
Put the brochure's two numbers on an investment. Rs 10 lakh for the seven years the fund has been live. At the back tested 18 percent a year it becomes about Rs 31.9 lakh. At the 9 percent the fund actually earned, about Rs 18.3 lakh. The Rs 13.6 lakh gap is the price of reading the cover instead of the small print.
The pipe, step by step
The opening's four stages are worth slowing down, because each one moves money and each one shrinks the edge a little.
- AnomalyA pattern that pays because few people are looking for it.
- PublicationA paper gives it a name, a formula and a back test anyone can repeat.
- ProductAn index and funds follow, so money can buy the pattern in one order.
- CommodityEnough money chases it that what is left is roughly the cost of holding it.
The same gap in NSE's own factsheets
You do not need a foreign brochure to see this. NSE Indices publishes each factor index's long run return with the years before launch filled in by back calculation, and the factsheet also shows the last five years. For indices launched before October 2021, those five years are all live.
- Nifty Alpha 50 launches
Base date 31 Dec 2003, so its first nine years are back calculated.
- NIFTY200 Quality 30 launches
History from April 2005 is back calculated.
- Nifty200 Momentum 30 launches
The most tracked factor index; history from April 2005 is back calculated.
- Nifty Midcap150 Momentum 50 launches
Momentum in the mid cap universe.
- Nifty200 Value 30 launches
Value gets a large and mid cap index of its own.
Now set the two numbers side by side. The Nifty200 Momentum 30 shows 18.30 percent a year on total return since April 2005, and 9.28 percent over the five years to 30 Sep 2026, every one of them after its launch. The NIFTY200 Quality 30 shows 16.64 percent since 2005 and 6.40 percent over the last five, all after its 2018 launch.
- Momentum 30, since 200518.30%
- Momentum 30, last 5 years9.28%
- Quality 30, since 200516.64%
- Quality 30, last 5 years6.40%
- Nifty 200, last 5 years8.30%
Total return CAGR. Since 2005 figures include years before launch that are back calculated. NSE Indices factsheets, 30 Sep 2026.
Two cautions before reading this as proof of decay. Five years is short, and both indices spent the last two of them in a hard patch: momentum and quality were the two weakest factor indices over the two years to 9 Oct 2026. And not every factor shows the pattern. The Nifty200 Value 30 earned 22.91 percent a year over the five years to 30 Sep 2026, well above its 16.12 percent since 2005, though most of those five years predate its June 2024 launch. Part of the reason is that value started the window cheap and unloved. Crowding and starting price are the same story told from two ends.
The same rule applies to RupeeCase's own strategy pages, where every figure is labelled model and back tested with its as of date. The free Learn module on factor timing and cycles explains why crowded factors go through long quiet spells and how valuation spreads show it, with a quiz. The posts on the factor zoo and turnover tax cover the two other costs that eat a published premium.
Questions readers ask
What is factor decay?
It is the shrinking of a factor's excess return after the pattern becomes widely known and money flows in to capture it. Studies of published anomalies have found that returns after publication are often well below the original back test. A brochure showing 18 percent back tested and 9 percent live is the same effect at fund level.
What does back calculated mean on an NSE index factsheet?
It means the index values before its launch date were computed later by applying the index rules to past data. That history is a model, not a record of money invested. The Nifty200 Momentum 30 launched in August 2020, so its figures since 2005 include about 15 years of back calculation.
Is a crowded factor bound to stop working?
Not necessarily. Crowding usually lowers the premium and raises the risk of sharp reversals when money leaves, rather than ending the factor. Value shows the other side: after a long unloved spell, the Nifty200 Value 30 returned 22.91 percent a year over the five years to 30 Sep 2026.
The cards
3 cards. Swipe, or tap to open.
Explore next
Learn it properly, then see it applied.
See the idea in an index: Midcap Smallcap. Model, back tested figures and the rules are on its page.
Related
- The factor zooHou, Xue and Zhang rebuilt 452 published factors and found 65 percent failed a basic test and 82 percent failed an honest one.Factors . . 5 min
- The turnover tax on a factorA 5.7 percent gross premium became 4.2 after trading costs, and factors traded slower than about half the book a month tend to keep a net edge.Factors . . 6 min
- The edge decays when you read about itMcLean and Pontiff measured 26 percent decay out of sample and 58 percent after publication, which stretches a 0.60 Sharpe's proof time from 11 years to 59.Factors . . 13 min
Educational content only. Figures are illustrative and computed on historical or representative data for teaching purposes, not investment advice. Past performance does not guarantee future returns. Sourced from NSE, BSE, SEBI, AMFI and RBI public data.
Community
Join my WhatsApp group.
Scan the code, fillFill one short form, and join my WhatsApp group. Slides, sources, factsheets and the rebalance logs live there, and members join a daily Google Meet with me.
New to RupeeCase? Getting started See the terminal