



Company numbers..5 min read
ROCE below WACC is capital destroyed politely
Sales up 9 percent and ROCE up 4 points still destroy value when ROCE sits at 9 and the cost of capital at 12, because EPS rises the day you borrow and EVA does not.
By Tanmay Kurtkoti, founder of QC Alpha and builder of RupeeCase
Friend forwarded a screenshot Thursday evening. Midcap industrial. Sales up 9 pct YTD. PAT up 12 pct. ROCE up 4 percentage points. Caption read "look at this compounder."
Pulled the fourth column nobody opens. WACC, the weighted average cost of the capital this company actually rents from its lenders and shareholders, sits at 12 pct on its current structure. ROCE at 9. The spread is minus 3 pp.
The growth is real. The compounding is not.
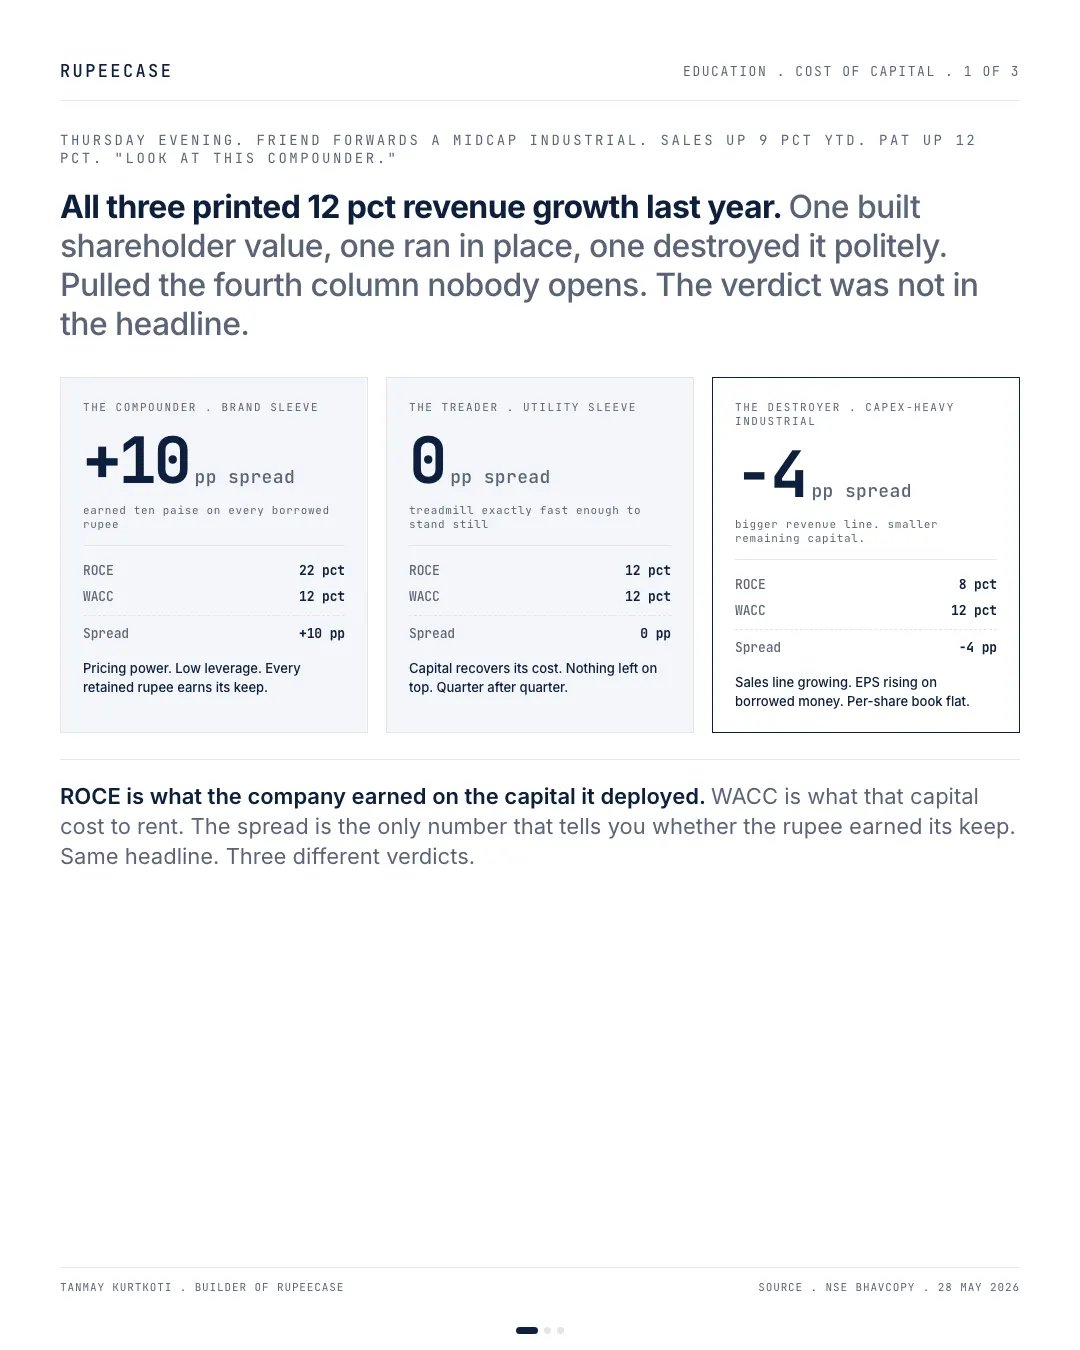
ROCE tells you what the company earned on the capital it deployed. WACC tells you what that capital cost. The spread is the only return metric that asks the question that matters. Did the rupee earn back what it cost to rent.
The Indian listed cohort runs WACC roughly 11 to 14 pct depending on sector beta and leverage. The wealth creators sit at ROCE 18 to 25 pct, spread plus 6 to plus 13 pp, every rupee retained earns its keep and then some. The treaders sit at ROCE 11 to 13 pct, spread roughly zero, treadmill exactly fast enough to stand still. The wealth destroyers sit at ROCE 4 to 8 pct, spread minus 3 to minus 8 pp, big revenue line every quarter. Smaller remaining capital every year.
The trap is mechanical. Borrow at 9 pct post tax. Invest the borrowed rupee in a project earning 12 pct. The income statement records the 12 pct. EPS rises. The accountant claps. But if WACC was 13 because equity holders price the risk higher than debt did, capital was destroyed on that project. Politely. The income statement counted the rupee that arrived. The cost of capital is the rupee that should have arrived. The gap is the verdict.
Stewart 1991 codified this as EVA. McKinsey teaches it. Damodaran prices it every January. Nobody puts it on the cover of the annual report.
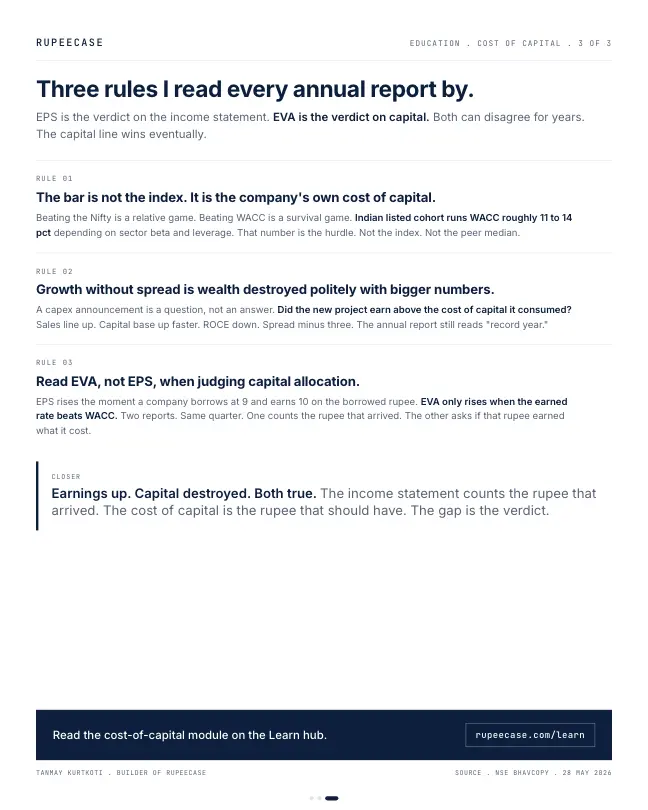
Three rules I read every annual report by. The bar is not the index, it is the company's own cost of capital. Growth in revenue without ROCE above WACC is wealth destroyed politely with bigger numbers. EPS goes up the day you borrow, EVA only goes up when the borrowed rupee beats its cost.
Earnings up. Capital destroyed. Both true
The spread in one picture
Here is the midcap from the opening reduced to its three numbers. Treat the 9 percent ROCE as an after tax return, so it compares like for like with an after tax cost of capital.
ROCE: what the capital earned
Worked example, not a company
WACC: what the capital cost
Worked example, not a company
The spread: value lost on every rupee, every year
Worked example, not a company
Build the 12 percent yourself
WACC sounds like a banker's number. It is four inputs and two multiplications. Take a Company A with Rs 1,000 crore of capital employed: Rs 400 crore borrowed and Rs 600 crore of shareholders' money.
- Cost of debt after taxThe loans cost 9 percent. Interest is tax deductible, so at a 25 percent tax rate the real cost is 9 x 0.75 = 6.75 percent.
- Cost of equityShareholders carry more risk than lenders, so they want more. Say 15.5 percent for this business. There is no invoice for it, which is why it is ignored.
- Weight each oneDebt is 40 percent of the capital, equity 60 percent. 0.4 x 6.75 = 2.7. 0.6 x 15.5 = 9.3.
- Add2.7 plus 9.3 is a WACC of 12.0 percent. That is the bar every rupee of capital has to clear.
The cost of equity is the input people argue about, and it is the one the income statement never shows. Interest appears as a line called finance costs. The return shareholders expect appears nowhere. So a company can report a profit every year while earning less than its owners could expect from taking the same risk elsewhere.
EVA: the profit after the capital is paid for
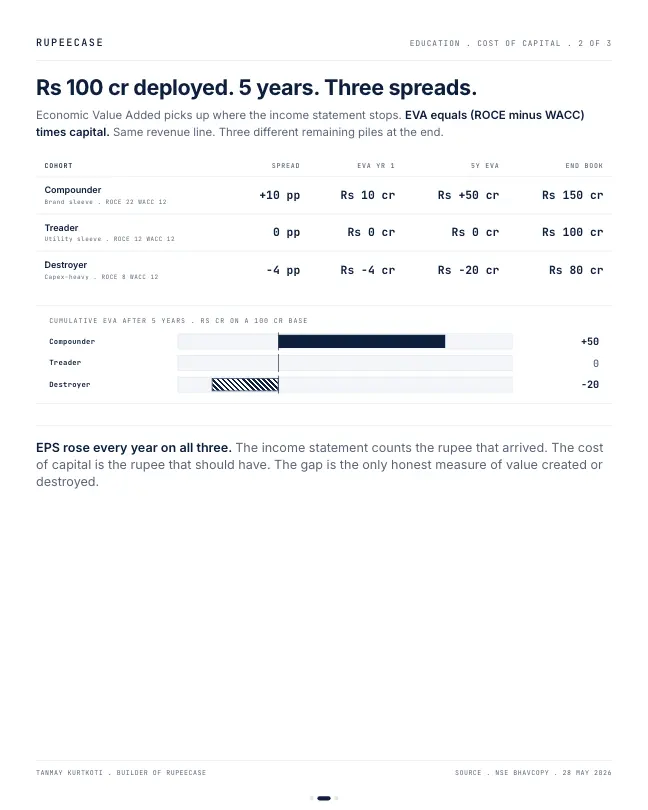
Economic value added puts the missing line back. Take the after tax operating profit and subtract a charge for all the capital at WACC. For Company A, 9 percent on Rs 1,000 crore is Rs 90 crore of after tax operating profit. The capital charge at 12 percent is Rs 120 crore. EVA is minus Rs 30 crore. Every year the income statement shows a profit, the owners are Rs 30 crore poorer than if the capital had earned its cost.
Push ROCE to 20 percent on the same capital and EVA becomes plus Rs 80 crore. Same sales line, same headline growth possible, opposite outcome for the owner. Growth multiplies whichever sign the spread already has.
Why EPS goes up the day you borrow
Now the trap from the opening, in rupees. Company A borrows another Rs 200 crore at 9 percent and builds a plant that earns 10 percent after tax, Rs 20 crore a year. The interest after tax is Rs 13.5 crore. Net profit rises by Rs 6.5 crore, no new shares are issued, so EPS rises. The results release calls it accretive.
Charge the new capital at the 12 percent the business needs, though, and the plant owes Rs 24 crore a year. It earns Rs 20 crore. EVA on the project is minus Rs 4 crore. (Extra debt also changes the mix and the risk, so the true WACC moves a little. The sign does not.)
- Plant return after tax+20
- Interest after tax-13.5
- Added to net profit+6.5
- Capital charge at 12%-24
- EVA on the plant-4
Rs crore a year. Debt at 9 percent, tax at 25 percent, WACC 12 percent. Worked example, not a company.
When I read an annual report, the capital expenditure plan is where this shows up first. Ask what return the new capacity has to earn, then compare it with the company's own cost of capital, not with last year's EPS growth. The free Learn module on capital allocation walks through reinvestment, dividends, buybacks and acquisitions with this same test. The post on DuPont and the three routes to the same ROE shows how leverage can make a weak return look strong.
Questions readers ask
What is the difference between ROCE and WACC?
ROCE is what a company earns on the capital it uses, debt plus equity. WACC is what that capital costs, the blended return lenders and shareholders expect. A company creates value only when ROCE stays above WACC year after year.
How is EVA calculated?
EVA is after tax operating profit minus a capital charge, which is capital employed times WACC. A company earning 9 percent on Rs 1,000 crore with a 12 percent WACC has an EVA of minus Rs 30 crore, even though it reports a profit.
Can a company with growing profits destroy value?
Yes. If new capital is invested below the cost of capital, profit and EPS can still rise, especially when the capital is borrowed, because the income statement charges only interest and never the return shareholders expect. The spread tells you whether growth is adding value or subtracting it.
The cards
3 cards. Swipe, or tap to open.
Explore next
Learn it properly, then see it applied.
- Free module 1.4Reading Financial Statements11 min read
- Free module 9.3Capital Allocation, The Most Important Skill11 min read
- StrategyMidcap strategyNifty Midcap 150, 20 stocks, every 2 weeks
- StrategyNifty 50 Equal Weight strategyNifty 50, 50 stocks, every 4 weeks
- Blog topicCompany numbers notes24 notes
Indices in this note: Midcap and Nifty 50 Equal Weight. Model, back tested figures and the rules are on each page.
Related
- DuPont: same ROE, three different businessesThree Nifty 200 stocks at 20 percent ROE got there by margin, by turnover and by a 4x equity multiplier, and only one of those levers survives a bad year cleanly.Company numbers . . 7 min
- Three ways to make eighteen percentA brand, a retailer and a lender all show 18 percent ROE from 18x1x1, 3x3x2 and 20x0.09x10, and their returns on assets are 18, 9 and 1.8 percent.Company numbers . . 12 min
- Same net profit, two different quartersTwo companies printing Rs 245 crore of net profit collected Rs 220 crore and Rs 38 crore of operating cash, and the accruals gap is the line that does not negotiate.Company numbers . . 5 min
Educational content only. Figures are illustrative and computed on historical or representative data for teaching purposes, not investment advice. Past performance does not guarantee future returns. Sourced from NSE, BSE, SEBI, AMFI and RBI public data.
Community
Join my WhatsApp group.
Scan the code, fillFill one short form, and join my WhatsApp group. Slides, sources, factsheets and the rebalance logs live there, and members join a daily Google Meet with me.
New to RupeeCase? Getting started See the terminal