



Returns and risk maths..7 min read
Drawdown: depth vs duration
Two funds with the same 20 percent max drawdown spent seven and twenty six months below their old highs, and the wait is where plans die by quiet quitting.
By Tanmay Kurtkoti, founder of QC Alpha and builder of RupeeCase
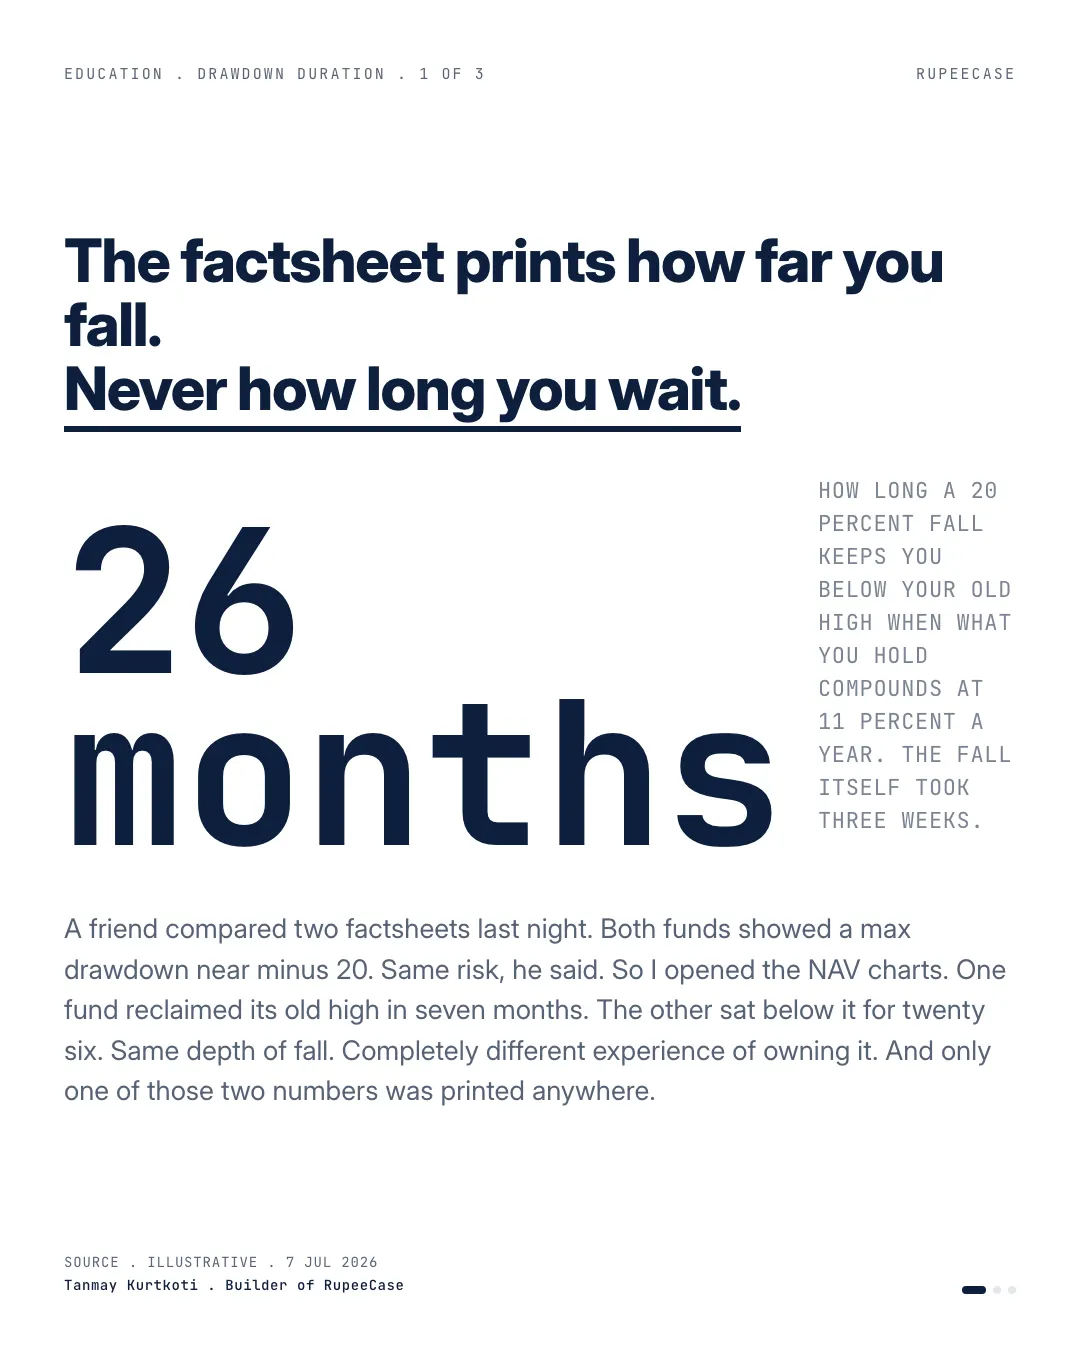
A friend sent me two factsheets last night. Both funds showed a max drawdown near minus 20 percent. Same risk, he said.
So I opened the NAV charts side by side. One fund fell 20 and reclaimed its old high in seven months. The other fell 20 and sat below its old high for twenty six months. Same depth. Completely different experience of owning it. And only one of those two numbers was printed anywhere.
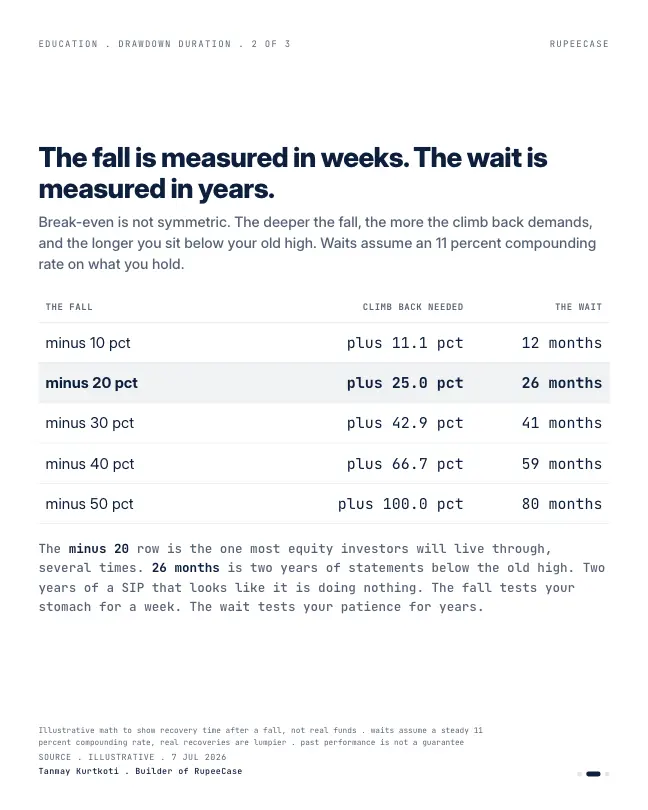
The math of the wait is worse than people expect. A 20 percent fall needs a 25 percent climb just to break even. If what you hold compounds at 11 percent a year, that is roughly 26 months of statements below the old high. A 40 percent fall needs 67 percent back. Call it five years. The fall is over in weeks. The wait is measured in years.
And the wait is where plans actually die. Panic selling gets all the attention because it is dramatic. A red week, one bad decision. Quiet quitting is slower. Month 14 of flat. The SIP gets paused, just for now. A small withdrawal that was going to be temporary. Nobody calls any of it selling at the bottom. The compounding stops all the same.
Honest version: if you are still accumulating, the long flat stretch is the discount window. Every instalment below the old high buys cheaper units. But that only pays if you keep buying through it, and that takes a kind of patience no drawdown number on a factsheet can measure.
Every risk questionnaire asks what you would do at minus 20. Almost none ask what you would do after two years of nothing. Answer both before you pick:
The arithmetic of the wait
Two numbers decide how long you sit below an old high: how far it fell, and how fast it compounds back. The climb you need is always bigger than the fall, because the climb starts from a smaller base.
Climb needed = 1 / (1 minus fall) minus 1. For a 20 percent fall: 1 / 0.80 = 1.25, so 25 percent. Months to get there at a steady yearly return r = 12 x ln(1.25) / ln(1 + r). At 11 percent a year that is 12 x 0.223 / 0.104 = about 26 months. Real recoveries are never steady, so read this as the pace if the market simply goes back to normal, not a forecast.
Try 40 and 11. You get 67 percent and about 59 months. The depth doubled, the wait more than doubled.
Same depth, different waits, on NSE's own indices
This is not a thought experiment. NSE index data from the last two years has a clean pair, measured from each index's record close.
The Nifty500 Value 50 closed at a record 15,616.30 on 31 Jul 2024 and fell to 12,010.65 by 28 Feb 2025, a drawdown of 23.09 percent. The Nifty Smallcap 250 closed at a record 18,623.15 on 23 Sep 2024 and fell to 13,755.90 by 3 Mar 2025, a drawdown of 26.14 percent. On a factsheet those two lines would look like twins.
Now the wait. The Value 50 first closed above its record on 2 Jan 2026, about 17 months after it was set. The Smallcap 250 has not done it at all. It came within 0.5 percent on 8 Sep 2026, at 18,527.20, and slipped back. On 12 Oct 2026 it was 4.6 percent below, more than two years on.
- Nifty 50, 15.8% fall15 months
- Value 50, 23.1% fall17 months
- Smallcap 250, 26.1% fall24+ months
- Momentum 30, 31.8% fall24+ months
Months from each index's record close in 2024 to its first close above it; "+" means still below on 12 Oct 2026. NSE price indices, dividends excluded, records taken from NSE daily closes since 1 Jan 2024. NSE bhavcopy index history.
The other two rows complete the picture. The Nifty200 Momentum 30 is the deeper case: a 31.79 percent fall from its 27 Sep 2024 record, and still 23.1 percent under it on 12 Oct 2026. The Nifty 50 fell 15.77 percent from its 26 Sep 2024 record and closed above it again on 2 Jan 2026, at a new record of 26,328.55. It has been under that one since: 22,363.35 on 12 Oct 2026, 15.1 percent below, nine months in.
A caveat I owe you. These are price indices, so dividends are left out, and the records are the highest closes in the NSE daily files I pulled, which start on 1 Jan 2024. On that day each index sat at 72 to 83 percent of its later record.
With each index's record close set to 100, the Value 50 ended Jan 2026 at 102.3, its first month end above the record, and Sep 2026 at 97.5. The Smallcap 250 got no higher than 98.7 at a month end, in Aug 2026, and ended Sep 2026 at 95.6.
Month end closes, each index divided by its own record close (Value 50, 15,616.30 on 31 Jul 2024; Smallcap 250, 18,623.15 on 23 Sep 2024) and multiplied by 100. NSE price indices, Dec 2024 to Sep 2026 (NSE bhavcopy).
What a long wait feels like from inside is not one dip. It is hope, then a second leg, then more waiting:
- The record: 18,623.15
The Smallcap 250 closes at the level every later statement is measured against.
- The low: 26.1 percent down
The whole fall takes a little over five months.
- Nearly home
The month ends at 95.6 percent of the record. Then it slips again.
- A second leg down
Month end at 76.7 percent of the record, 18 months after it was set.
- Within half a percent
18,527.20, highest since Mar 2025. It does not cross.
- Still waiting
17,772.80, 4.6 percent below the record, more than two years after it was set.
Month 14, in rupees
Here is the original story's "month 14", priced with real index closes. Suppose an investor put Rs 10,000 into the Smallcap 250 at the close of every month from 31 Dec 2024, three months after the record, with the index already 4.7 percent below it.
Keep it going for 21 instalments, to 31 Aug 2026, and Rs 2,10,000 had gone in. At the 31 Aug 2026 close of 18,372.10 those units were worth about Rs 2,34,500, a gain of about 11.7 percent. The index itself was still 1.3 percent below its Sep 2024 record that day. The flat stretch was the discount window, exactly as the opening says.
Now pause at month 14, after the Jan 2026 instalment, "just for now". Rs 1,40,000 had gone in, worth about Rs 1,57,700 on the same day. Nothing was sold. Nothing dramatic happened. But seven instalments made below the record, including March 2026 at 14,288.45, one of the lowest closes of the whole stretch, were never bought.
The figures are price only, before costs and tax, and they do not say the next wait will end the same way. They show where the damage of quiet quitting sits.
What to ask before you pick
Our own strategy cards print the maximum drawdown: Smallcap at minus 22.34 percent, Microcap at minus 26.43 percent (Model, back tested, as of 27 Apr 2026). That number answers "how deep". It does not answer "how long". So I ask a second question of every line I look at, ours included: what was the longest stretch below a previous high, and what would I have been doing in month 14 of it?
The free Learn module on risk metrics puts depth, duration, volatility and Sharpe side by side with worked examples and a short quiz: Risk Metrics That Matter. For the twin mistake on the return side, quoting a total without its time, see the bigger number is the smaller return.
Questions readers ask
How long does it take to recover from a 20 percent fall?
You need a 25 percent gain to get back to the old high. At a steady 11 percent a year that takes about 26 months; at 15 percent about 19 months. Real recoveries are uneven: the Nifty500 Value 50 fell 23.1 percent and was back above its record in about 17 months, while the Nifty Smallcap 250 fell 26.1 percent from its 23 Sep 2024 record and had still not closed above it on 12 Oct 2026, more than two years later.
What is drawdown duration?
It is the time between a high and the first day the value closes above that high again. Factsheets usually print only the depth of the worst fall. Two funds with the same depth can have very different durations, and the duration is the part that tests whether an investor keeps going.
The cards
3 cards. Swipe, or tap to open.

Explore next
Learn it properly, then see it applied.
- GuideWhat to do when the stock market crashes: drawdowns, recoveries and a planThe recovery maths, how long falls lasted, and a plan written before the next one.
- CalculatorCAGR calculatorFree, with the formula and a worked example
- Free module 2.3Risk Metrics That Matter8 min read
- CalculatorDrawdown and recoveryFree, with the formula and a worked example
- StrategySmallcap strategyNifty Smallcap 250, 50 stocks, every 2 weeks
- StrategyMicrocap strategyNifty Microcap 250, 50 stocks, every 2 weeks
Indices in this note: Smallcap and Microcap. Model, back tested figures and the rules are on each page.
Reading path
Stop 3 of 10 on Start here
Related
- The average year mythIn twenty years of Nifty calendar returns only two landed near the 12 percent long run rate, with nine years above 20 percent and 2008 giving back about half.Returns and risk maths . . 5 min
- The bigger number is the smaller returnA fund up 214 percent over twelve years earned about 10 percent a year, roughly half the 19 percent a year of the fund with the smaller looking figure.Returns and risk maths . . 6 min
- Real vs nominal: the three numbers in a returnA 6.5 percent fixed deposit becomes 4.55 after top slab tax and about 0.6 percent after 4 percent inflation, and turns real negative at the RBI's 6 percent ceiling.Returns and risk maths . . 5 min
Educational content only. Figures are illustrative and computed on historical or representative data for teaching purposes, not investment advice. Past performance does not guarantee future returns. Sourced from NSE, BSE, SEBI, AMFI and RBI public data.
Community
Join my WhatsApp group.
Scan the code, fillFill one short form, and join my WhatsApp group. Slides, sources, factsheets and the rebalance logs live there, and members join a daily Google Meet with me.
New to RupeeCase? Getting started See the terminal