

Company numbers..10 min read
Three ways to make eighteen percent
A brand, a retailer and a lender all show 18 percent ROE from 18x1x1, 3x3x2 and 20x0.09x10, and their returns on assets are 18, 9 and 1.8 percent.
By Tanmay Kurtkoti, founder of QC Alpha and builder of RupeeCase
Wednesday morning, a little past nine. A friend who runs a small advisory practice sends me a screenshot. It is a stock screener, the return on equity column sorted high to low, and he has drawn a red box around three rows sitting one under the other. All three read 18 percent. A consumer brand, a retailer, a lender.
"Same quality," he types. "Which one do I pick?"
I asked him to send me the rest of the columns. He did not have the rest of the columns. Nobody does, because the screen does not show them, and that is the entire problem. It took me about twenty minutes with a spreadsheet to show him why.
Return on equity is not a quality score. It is the answer to a multiplication, and the screen hands you the answer with the three factors deleted.
Return on equity is an answer, not a measurement
Here is the identity. I will state it once, plainly, and then never write it out again. Return on equity equals net margin times asset turnover times the equity multiplier.
Three numbers. Margin is what the company keeps out of every rupee of sales. Turnover is how many rupees of sales it squeezes out of every rupee of assets it owns. The equity multiplier is how many rupees of assets it runs for every rupee of its own money, which is a polite way of saying how much of the balance sheet was borrowed.
Multiply those three together and you get the number on the screen. Which means the number on the screen is a product, and a product can be reached from a dozen directions. A fat margin on a slow asset base gets you there. A thin margin spun very fast gets you there. A decent margin sitting on a balance sheet ten times the size of its equity gets you there as well.
The screener shows you the product. It does not show you which factor is doing the work. And if you cannot see the factors, you cannot answer the only question that matters in a bad year, which is which of them is about to move, and by how much.
Three completely different ways to arrive at the same eighteen
So I built three companies. All illustrative, all invented for the arithmetic, none of them anybody real.
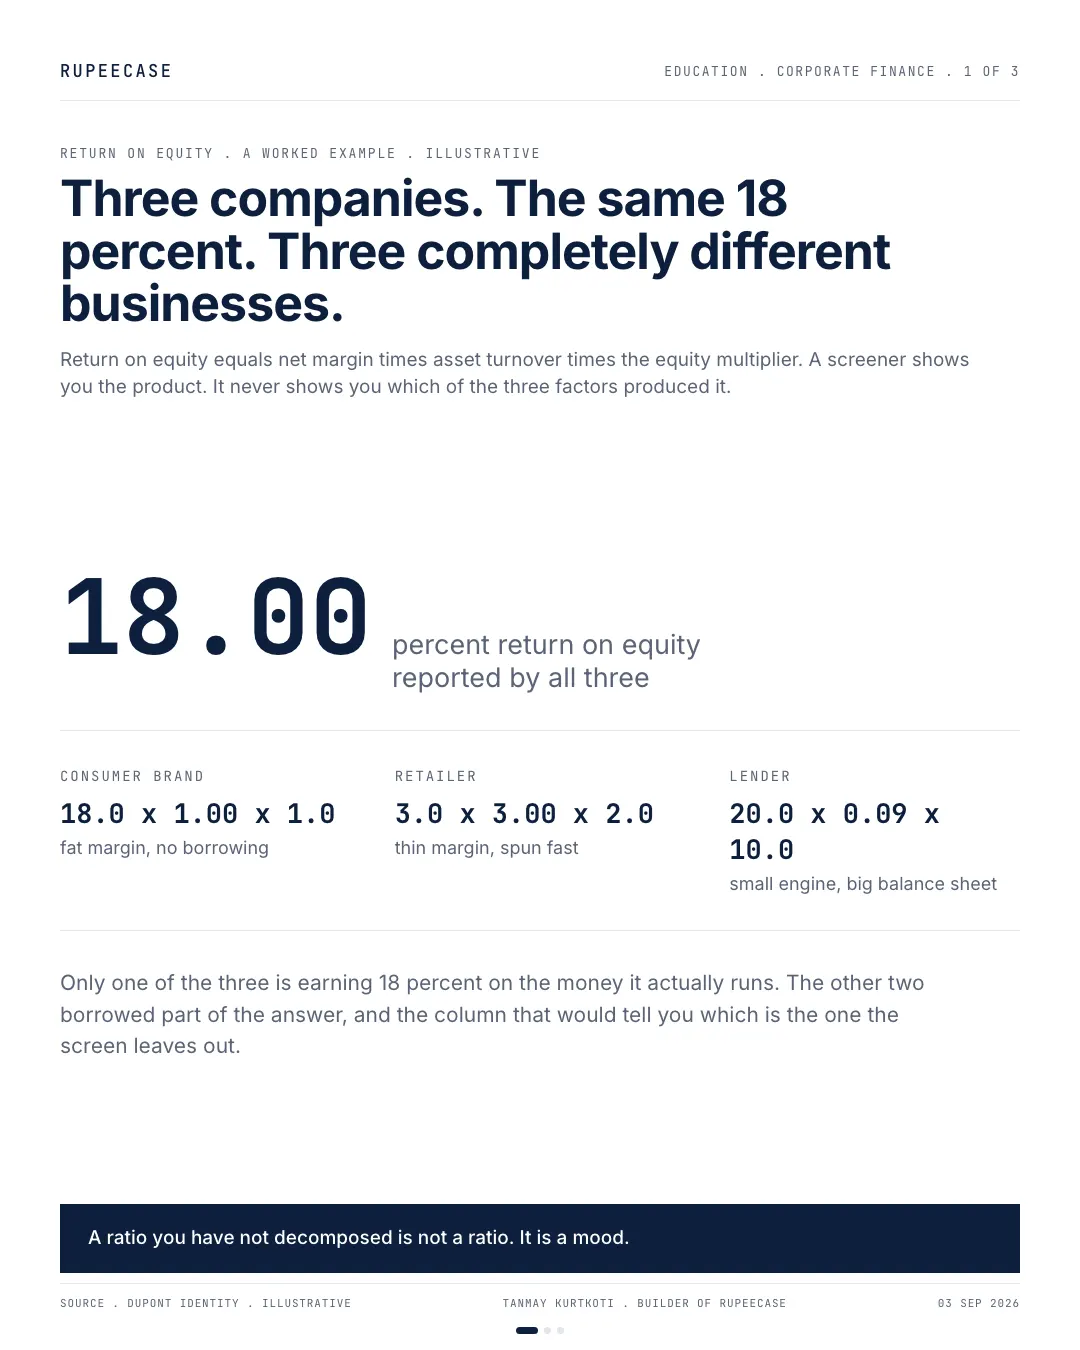
The brand keeps 18 paise out of every rupee of sales, turns its assets over once a year, and carries no borrowing at all. 18.0 times 1.00 times 1.0. Eighteen percent.
The retailer keeps 3 paise out of every rupee, which is brutal, but it turns its assets three times a year and runs two rupees of assets for every rupee of equity. 3.0 times 3.00 times 2.0. Eighteen percent.
The lender keeps 20 paise out of every rupee of revenue, turns its assets over 0.09 times, and runs ten rupees of assets for every rupee of its own. 20.0 times 0.09 times 10.0. Eighteen percent again.
Stack the three decompositions on top of each other and the shape of the problem shows up before you have finished reading them.
The third box in each row is the borrowed part, and I inked it in proportion to its size. That is the whole picture in one glance. The brand's eighteen is entirely its own. The retailer's is half its own. The lender's is a small number being multiplied by a large one, and the screen prints it in the same font as the other two.
The column the screener refused to show him
Now do the thing the screen will not do. Stop before the third term. Multiply margin by turnover and nothing else, and you get return on assets, which is what the business earns on everything it operates, borrowed or not.
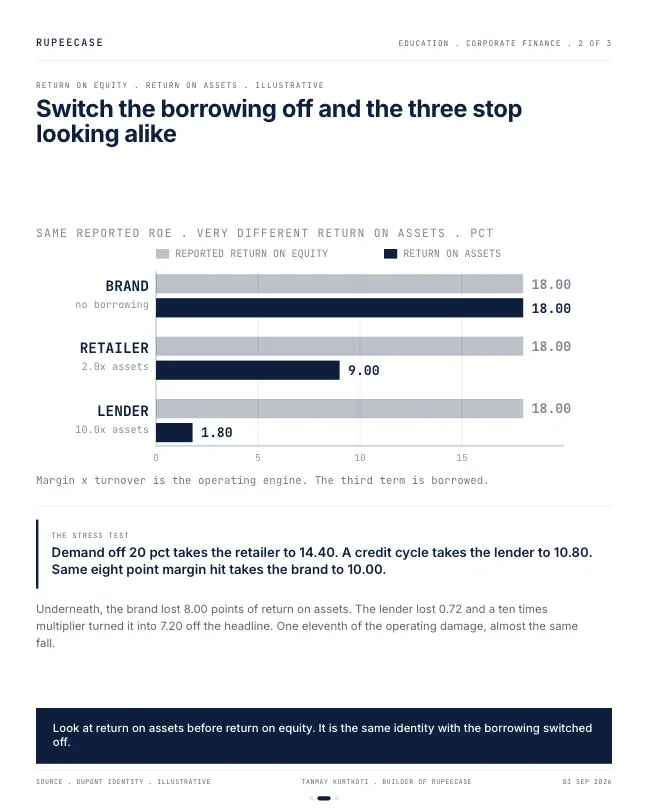
The brand earns 18.00 percent on its assets. The retailer earns 9.00. The lender earns 1.80.
I have run this exercise a few dozen times and that 1.80 still stops me. Three companies a screen calls identical, and their actual operating engines differ by a factor of ten. The lender is not earning eighteen percent on anything. It is earning one point eight percent on the money it deploys, and it reports eighteen because it deploys ten rupees for every one it owns.
Hold the judgment for a minute. That is a description, not an accusation. But it is the description the screener deleted, and my friend was about to buy something on the strength of a number he could not decompose. If you want the plain version of how these three terms behave, we wrote it up in the education notes on reading a balance sheet. The arithmetic is not hard. Nobody just bothers to do it.
So I gave all three of them a bad year
A ratio that only exists in a good year is not a ratio, it is a mood. So I ran a small shock through each one and kept everything else fixed.
Demand falls 20 percent. The retailer's turnover drops from 3.00 to 2.40, because the same shelves and the same warehouses are now moving less stock. Its return on equity falls to 14.40 percent.
A credit cycle turns. The lender's margin goes from 20 percent to 12, because provisions eat the spread. Its return on equity falls to 10.80 percent.
And because you should always run the control before you call a finding a rule, I gave the brand the same eight point margin hit the lender took, 18 down to 10. Its return on equity falls to 10.00 percent, exactly one for one, because there is no multiplier sitting behind it.
| Company | Net margin | Asset turnover | Equity multiplier | Return on equity | After the bad year |
|---|---|---|---|---|---|
| Consumer brand | 18.0 pct | 1.00 | 1.0 | 18.00 pct | 10.00 pct |
| Retailer | 3.0 pct | 3.00 | 2.0 | 18.00 pct | 14.40 pct |
| Lender | 20.0 pct | 0.09 | 10.0 | 18.00 pct | 10.80 pct |
All figures illustrative, computed from the identity above on three constructed companies. Read the last two columns together and the screen's version of "comparable" falls apart. The same starting number lands in three different places, and the spread between them, 14.40 against 10.00, is wider than most people's entire expected return.
The lender needed one eleventh of the damage
Here is the part that actually earns the piece its keep, and it is not the headline drop.
Look at what happened underneath. The brand's return on assets went from 18.00 to 10.00. That is eight full points of operating deterioration, a savage year, the kind where the product stops working. The lender's return on assets went from 1.80 to 1.08. That is a fall of 0.72 points.
Zero point seven two. And then the balance sheet multiplied it by ten, and 0.72 became 7.20 points off the headline.
Line all three outcomes up against the 18.00 they started from and you can see who travelled how far.
The bars say something the headline numbers hide. The brand fell furthest, to 10.00, and it deserved to, because its business genuinely broke. The lender landed at 10.80 having suffered roughly one eleventh of the operating damage. That is what a ten times multiplier does. It works in both directions with exactly the same enthusiasm, and the year it works downward is the year you find out what you actually bought.
Which is the second order point, and the one worth carrying around. Borrowing does not create returns. It rents them. The rent is cheap for years and then comes due in a single 12 month window, usually the same window in which the other two terms are also going against you.
Where this argument breaks, and it breaks cleanly
Here is the honest part, because I do not think the criticism applies evenly.
A high equity multiplier is not a defect in a lender. It is the product. A bank or an NBFC exists to run other people's money at a spread, and judging one by a manufacturer's balance sheet is its own category error, as silly as complaining that a shipping company owns too many ships. The distinction that matters is whether the liabilities are matched and regulated against the assets, or whether they are short term borrowings funding long term risk. Ten times gearing inside a regulated, duration matched book with a capital adequacy floor is a normal operating condition. Ten times gearing in a cyclical manufacturer with lumpy cash flows is a warning. Same number, opposite meaning, and no screener I have ever used draws that line.
So here is what would change my mind. If a company running ten times gearing held its margin steady through a genuine, full credit cycle, peak to trough and back, then the borrowing was matched to a spread that was actually stable, and this criticism does not stick to it. That is a testable claim. Pull ten years of margins, find the worst two, and look. Most of the time the margin moves. Sometimes it does not, and when it does not, the company has earned the multiplier.
The other caveat is that my three companies are toys. Real balance sheets have working capital cycles, off book obligations, and accounting choices that move all three terms at once. The decomposition is a lens, not a verdict.
Three rules I use before a screen gets to argue with me
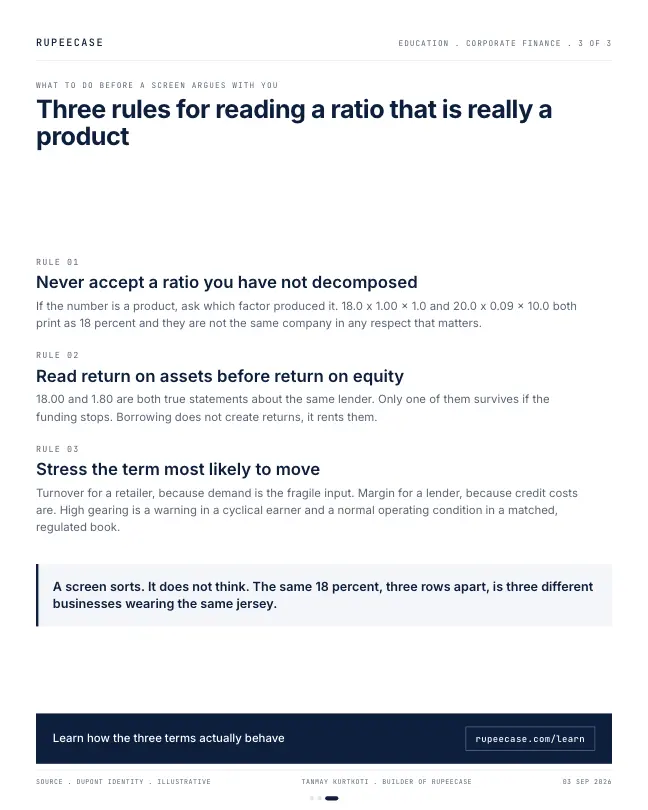
Never accept a ratio you have not decomposed. If a number is a product, ask which factor produced it. Two minutes with three columns tells you more about a business than an hour of reading the annual report's front section.
Look at return on assets before return on equity. It is the same identity with the borrowing switched off, and it is the only one of the two that tells you whether the operation actually works. Eighteen and 1.80 are both real numbers about the same company. Only one of them survives if the funding stops.
Stress the term most likely to move, not the one easiest to stress. For a retailer that is turnover, because demand is the fragile input. For a lender it is margin, because credit costs are. Guessing which term is load bearing is the actual analytical work, and it is exactly the part a rules based framework is built to make repeatable rather than a matter of mood. If you would rather see how two approaches diverge over a full cycle, put them side by side instead of ranking them on a single ratio.
My friend picked one in the end, and I have no idea whether he picked well. That was never the point. The point is that he now knows the eighteen he bought is 18.00 times 1.00 times 1.0 and not 20.0 times 0.09 times 10.0, which means he knows what has to go wrong before it stops being eighteen.
A screen sorts. It does not think. And the same 18 percent, three rows apart, is three different businesses wearing the same jersey.
Questions readers ask
What is the short answer?
A brand, a retailer and a lender all show 18 percent ROE from 18x1x1, 3x3x2 and 20x0.09x10, and their returns on assets are 18, 9 and 1.8 percent.
Where can I learn company numbers properly?
In the free RupeeCase Learn library: Company numbers, learn it free, no sign up needed. Modules come with quizzes, calculators and a path test.
Is this note investment advice?
No. It is an educational note by Tanmay Kurtkoti. RupeeCase is a technology platform, not a fund, a PMS or a SEBI registered investment adviser.
The cards
3 cards. Swipe, or tap to open.
Explore next
Learn it properly, then see it applied.
Related
- ROCE below WACC is capital destroyed politelySales up 9 percent and ROCE up 4 points still destroy value when ROCE sits at 9 and the cost of capital at 12, because EPS rises the day you borrow and EVA does not.Company numbers . . 5 min
- DuPont: same ROE, three different businessesThree Nifty 200 stocks at 20 percent ROE got there by margin, by turnover and by a 4x equity multiplier, and only one of those levers survives a bad year cleanly.Company numbers . . 7 min
- Profitable and brokeStretching receivable days from 45 to 95 on 40 percent growth turns a 140 profit into minus 101 of operating cash, and the banker read the third statement first.Company numbers . . 10 min
Educational content only. Figures are illustrative and computed on historical or representative data for teaching purposes, not investment advice. Past performance does not guarantee future returns. Sourced from NSE, BSE, SEBI, AMFI and RBI public data.