

RupeeCase | Systematic Quantitative Investing Terminal by QC AlphaRupeeCase | Systematic Quantitative Investing Terminal by QC AlphaRupeeCase | Systematic Quantitative Investing Terminal by QC AlphaRupeeCase | Systematic Quantitative Investing Terminal by QC Alpha
Start free

Hybrid, Nifty Total Market

TotalMarket Hybrid Nifty Total Market hybrid strategy

TotalMarket Hybrid is a RupeeCase index that holds 51 names from the Nifty Total Market, ranked by momentum, with 20% in debt, rebalanced every 2 weeks. Model CAGR 39.5% (back tested, as of 27 Apr 2026), minimum about ₹2,81,000 (as of 8 Aug 2026), moderate risk band.

50 stocks, 20% debt, no gold. Fortnightly rotation.

Moderate risk band

Runs in your own 5paisa, Zebu or Arrow demat. The shares stay in your name.
01At a glance

TotalMarket Hybrid in four numbers.

CAGR
39.53%Model, back tested
Max drawdown
−21.82%Model, back tested
Minimum investment
₹2.81LAbout ₹2,81,000
Fee per rebalance
0.2%Of traded value, nothing else
TotalMarket Hybrid, model₹581Nifty 50 TRI, 9.80% CAGR line₹162
150 200 300 500

₹100 in May 2021 became ₹581 by Jul 2026 (Nifty 50 TRI line ₹162). Model, back tested. As of 27 Apr 2026. After charges, log scale.

02Three steps

Compare. Validate. Invest.

  1. Compare

    Against the other 17 strategies, and funds, PMS and AIF.

    Compare strategies
  2. Validate the back test

    Every year, fall, holding and rebalance, in the factsheet.

    Open the factsheet
  3. Invest

    Link your broker and approve each rebalance. Stocks stay in your own demat; RupeeCase never holds your money.

    Invest in TotalMarket Hybrid

Invest, screen by screen

Watch the walkthrough, 0:46
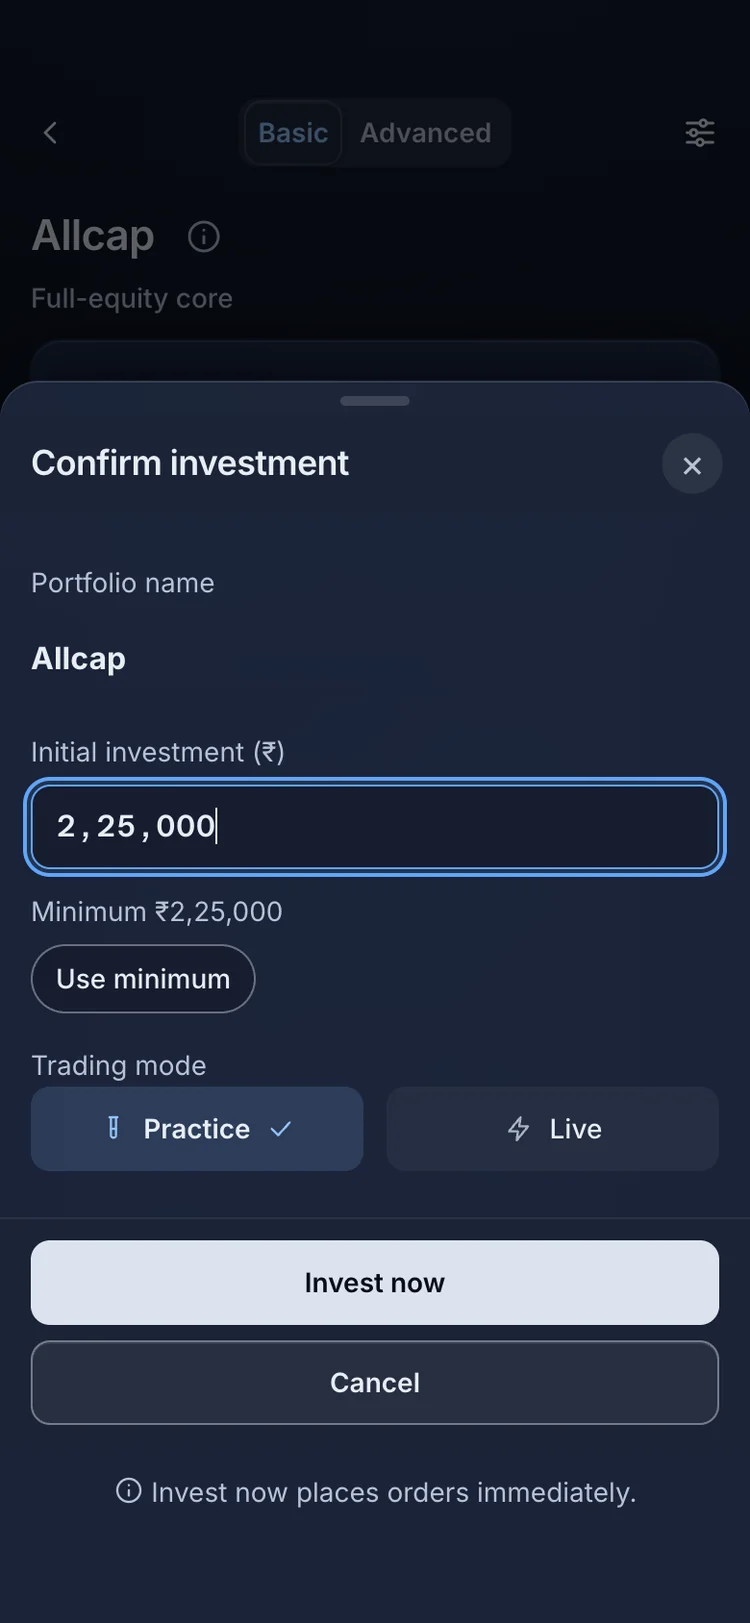
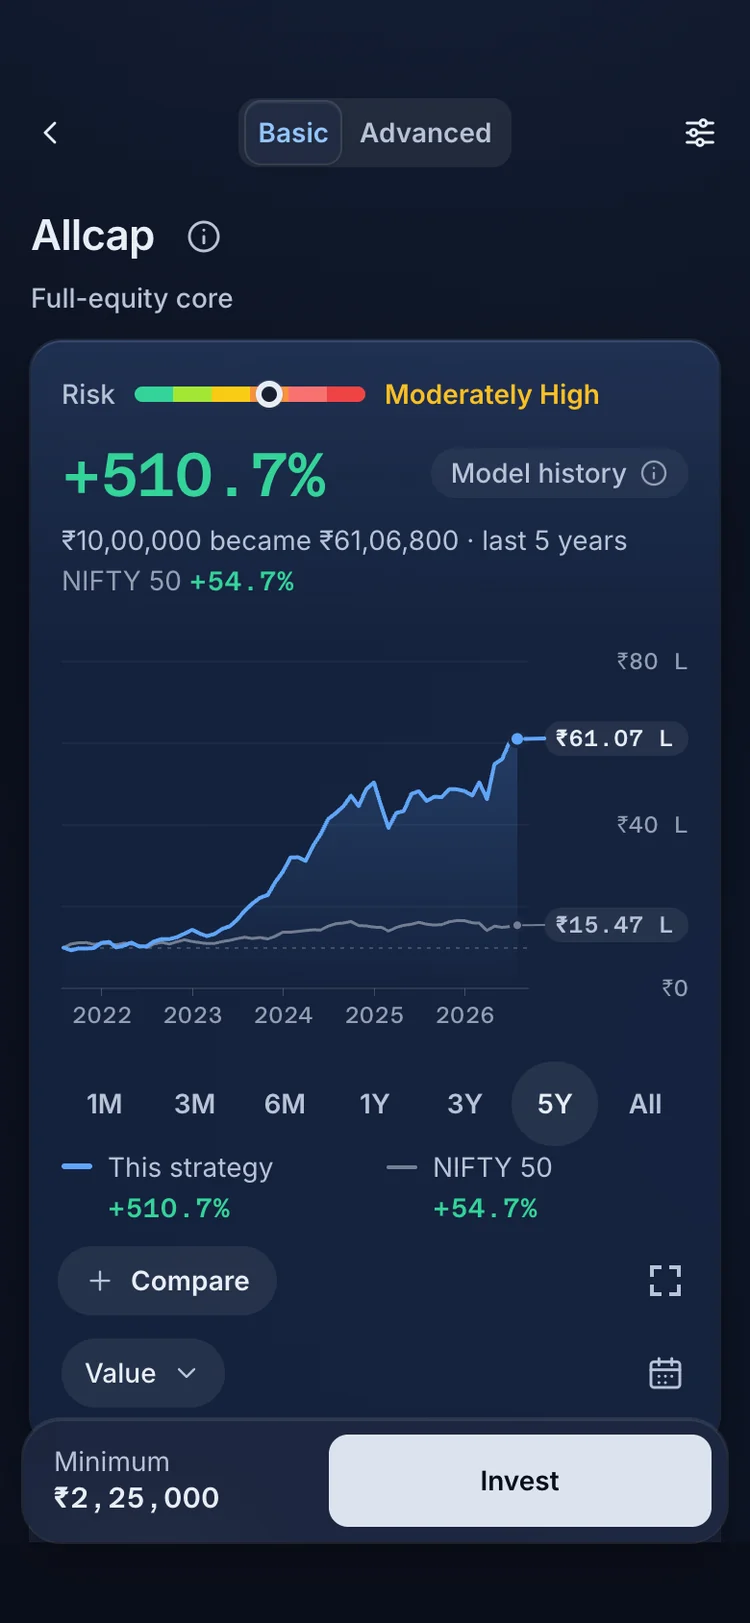
  1. The RupeeCase app on a phone. Each strategy page shows its model history and the Invest bar with the minimum.
    1Each strategy page shows its model history and the Invest bar with the minimum.
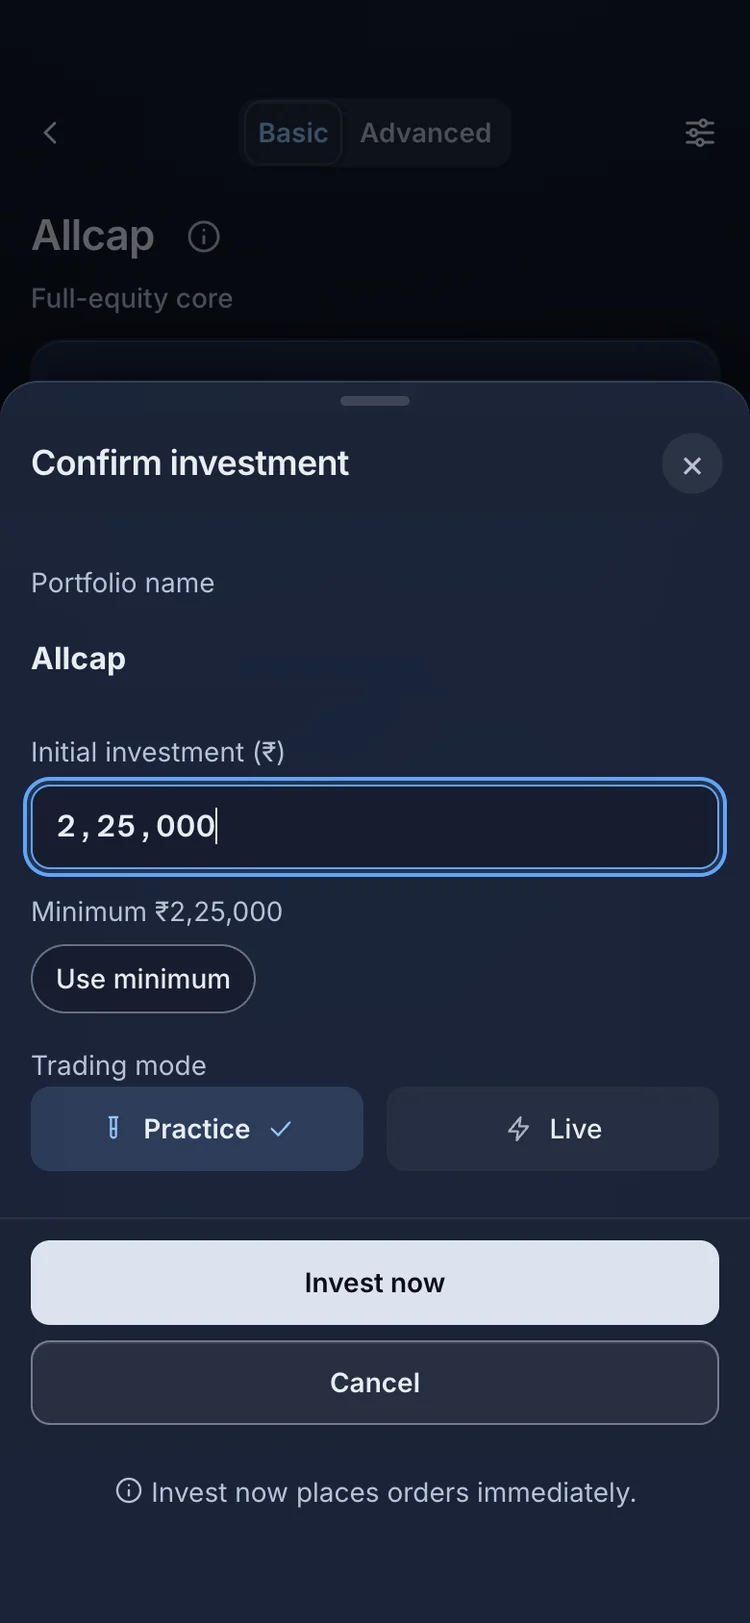
  2. The RupeeCase app on a phone. The sheet opens with the minimum as the amount; Use minimum puts it back.
    2The sheet opens with the minimum as the amount; Use minimum puts it back.
  3. The RupeeCase app on a phone. Practice follows the strategy with no real broker order.
    3Practice follows the strategy with no real broker order.
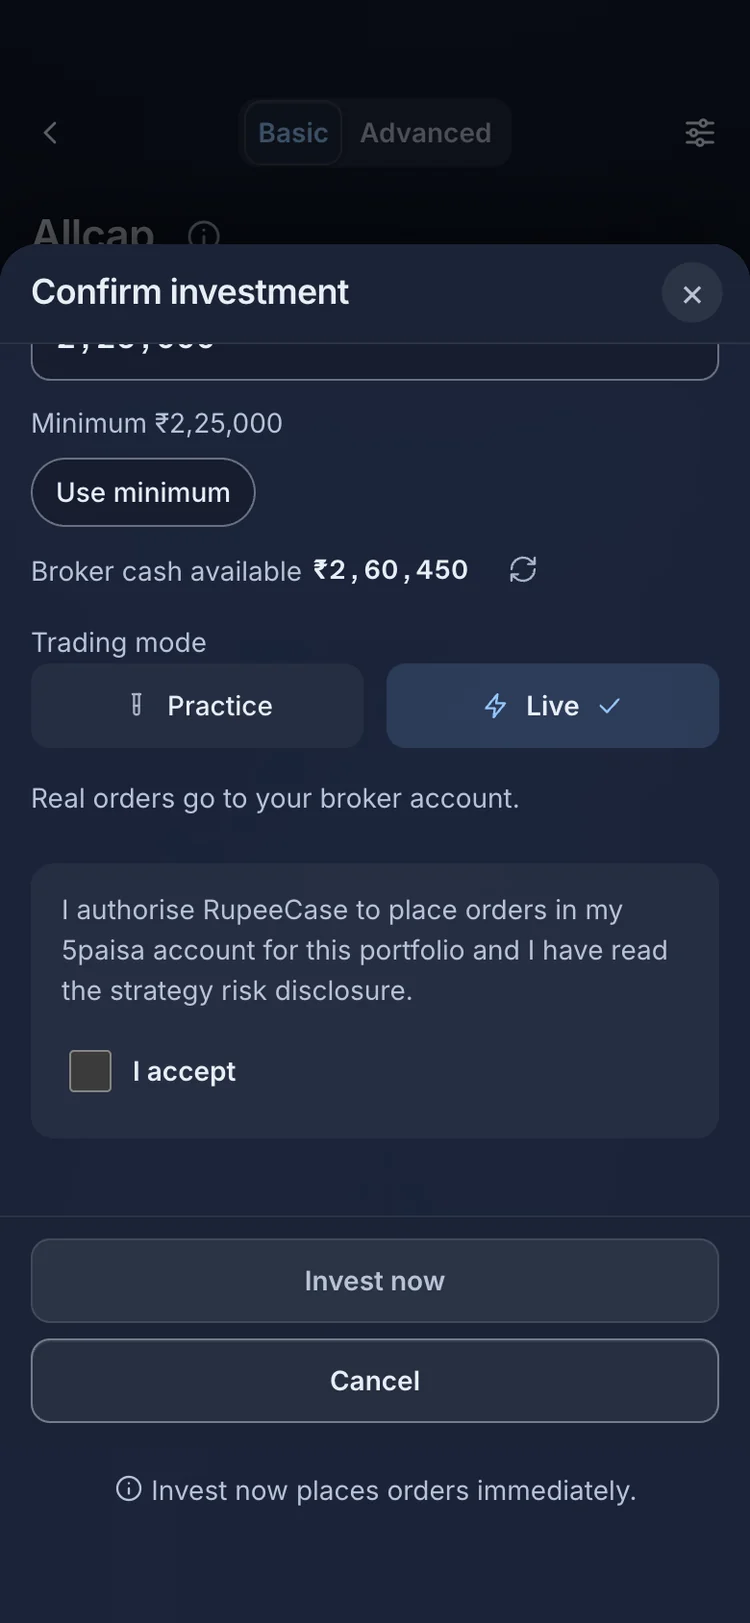
  4. The RupeeCase app on a phone. Live shows your broker cash and asks for your consent before any order.
    4Live shows your broker cash and asks for your consent before any order.

Screens from the RupeeCase app. Model, back tested figures as of 27 Apr 2026; portfolio screens are a sample for illustration.

Get the next rebalance by emailThe names in and out, on the morning TotalMarket Hybrid rebalances. Every 2 weeks. Free, one click to stop.

03Factsheet

TotalMarket Hybrid factsheet

Model, back tested, after charges; each block names its date.

Performance

Calendar year returns

  • 2021from May+32.9%
  • 2022+25.0%
  • 2023+87.8%
  • 2024+71.8%
  • 2025−3.8%
  • 2026to May+16.2%

Model, back tested, after charges, 2021 to May 2026.

What an amount would have become

You put in
₹2,81,000
Model value
 
Gain
 

Model, back tested monthly returns after charges, May 2021 to May 2026 (61 months).

Stress test: drag through the falls

MonthFeb 2025
Below the last peak−21.2%
Back to the peak 
Model value, log scaleBelow the last peak
Deepest falls, daily record
Exact dates of the deepest falls
  1. −21.82%20 Dec 2024 to 30 Jan 2026406 days
  2. −15.39%21 Jan 2022 to 5 Aug 2022196 days
  3. −10.80%9 Feb 2024 to 29 Mar 202449 days
  4. −10.48%6 Aug 2021 to 24 Sep 202149 days
  5. −10.20%6 Jan 2023 to 21 Apr 2023105 days

Daily model record over rolling 5 years: peak to low, and days until back at that peak.

Model, back tested. As of 27 Apr 2026. Month end values, May 2021 to Jul 2026, so falls read shallower than the daily figures on the buttons. Falls this deep can happen again.

Monthly returns

TotalMarket Hybrid: monthly model returns, percent, after charges
YearJanFebMarAprMayJunJulAugSepOctNovDecYear
2021no datano datano datano data3.29.27.4−5.64.1−0.31.110.8+32.9%
20221.7−10.23.86.2−7.40.49.94.4−0.23.65.86.4+25.0%
2023−5.9−3.73.48.14.19.312.28.46.02.812.79.1+87.8%
202411.40.2−2.811.18.09.33.43.85.5−5.28.83.4+71.8%
2025−11.6−10.99.00.99.31.4−4.72.3−0.24.0−0.1−0.8−3.8%
2026−2.26.7−7.917.72.7no datano datano datano datano datano datano data+16.2%

Model, back tested, after charges; one calendar month per cell, in percent.

Rolling returns

Any 1 year, return
Worst
−3.7%
Median
+25.7%
Best
+131.9%
Positive
96%of 51 windows
Any 3 years, CAGR
Worst
+40.8%
Median
+52.2%
Best
+62.9%
Positive
100%of 27 windows

Model, back tested, month end values, May 2021 to Jul 2026.

Holdings and sectors

48 holdings

  • Equity75%
  • Debt20%
  • LIQUIDCASE20.0%Debt
  • OLAELEC1.6%
  • STLTECH1.6%
  • GALLANTT1.6%
  • QPOWER1.6%
  • LLOYDSENT1.6%
  • CUPID1.6%
  • EIEL1.6%
  • WELCORP1.6%
  • KRN1.6%
  • ADANIPOWER1.6%
  • WEBELSOLAR1.6%
  • ANGELONE1.6%
  • HFCL1.6%
  • LLOYDSME1.6%
  • ADANIGREEN1.6%
  • APOLLO1.6%
  • PFOCUS1.6%
  • NATIONALUM1.6%
  • AVANTIFEED1.6%
  • JAYNECOIND1.6%
  • LLOYDSENGG1.6%
  • ABDL1.6%
  • THERMAX1.6%
  • AZAD1.6%
  • TDPOWERSYS1.6%
  • ADANIENSOL1.6%
  • KSB1.6%
  • ATHERENERG1.6%
  • INOXINDIA1.6%
  • DEEPAKFERT1.6%
  • HINDCOPPER1.6%
  • KAJARIACER1.6%
  • THANGAMAYL1.6%
  • ACUTAAS1.6%
  • ACMESOLAR1.6%
  • KIRLOSENG1.6%
  • OSWALPUMPS1.6%
  • SANSERA1.6%
  • FIVESTAR1.6%
  • MCX1.6%
  • GVT&D1.6%
  • AWFIS1.6%
  • IMFA1.6%
  • HEG1.6%
  • JINDALSAW1.6%
  • VEDL1.6%
  • BELRISE1.6%

Live quantities and prices are in the app. Sign up for RupeeCase

Weights on the rebalance day, 11 May 2026; they drift with prices until the next rebalance. Model portfolio, not a recommendation.

Sector allocation

  • Capital Goods25.5%
  • Power & Utilities14.9%
  • Metals & Mining14.9%
  • Chemicals12.8%
  • Auto & Components10.6%
  • IT & Technology6.4%
  • Banking & Financial6.4%
  • FMCG & Consumer6.4%
  • Realty & Construction2.1%

9 sectors in the equity sleeve. Same 50-stock equity universe as Allcap and Allcap Multi Asset, with 20% debt sleeve instead of 10% debt + 10% gold.

Sector weight by year

170 rebalances, 13 sectors touched, 11 held now.

Show the year by year sector table
Average sector weight of the equity sleeve in each year, percent, and the weight on the latest published list
Sector202120222023202420252026Now
Other, not yet mapped70697168682520
Capital Goods45465917
Power & Utilities88553617
IT & Technology32224711
Chemicals11022511
FMCG & Consumer2224257
Metals & Mining55655144
Banking & Financial33645114
Auto & Components11112104
Energy & Oil & Gas0211142
Realty & Construction0000002
Pharma & Healthcare102334out
Textiles000001out

Average weight of the equity sleeve that year, equal weighted at the stock level; darker is higher. Now: the list of 8 May 2026.

Rebalances

The rebalance record

published rebalances
170
first in the record
14 May 2021
26 a year
Every 2 weeks
latest published
8 May 2026

A fixed calendar; you approve each rebalance before your broker places the orders.

Latest rebalance, 8 May 2026

Against the list of 1 May 2026: 23 in, 24 out, 24 held, 47 on the list.

In
  • BHEL
  • COHANCE
  • HCC
  • KIRLPNU
  • BALAMINES
  • JAIBALAJI
  • HSCL
  • DATAPATTNS
  • SCI
  • SKYGOLD
  • SKIPPER
  • ELECON
  • BSE
  • PTC
  • PNBHOUSING
  • SYRMA
  • SUZLON
  • NETWEB
  • DIACABS
  • FINCABLES
  • BANDHANBNK
  • GOKULAGRO
  • ASHAPURMIN
Out
  • OLAELEC
  • EIEL
  • ANGELONE
  • PFOCUS
  • NATIONALUM
  • AVANTIFEED
  • ABDL
  • KSB
  • INOXINDIA
  • DEEPAKFERT
  • HINDCOPPER
  • KAJARIACER
  • THANGAMAYL
  • ACMESOLAR
  • OSWALPUMPS
  • SANSERA
  • FIVESTAR
  • MCX
  • AWFIS
  • IMFA
  • HEG
  • JINDALSAW
  • VEDL
  • BELRISE

The 24 held names are in Holdings.

Model, back tested record. In plus held is the list size, which can differ from the 51 stock target. Not recommendations.

Recent rebalances

The latest 6 rebalances: names on the list, names in and names out
DateOn the listInOut
8 May 202647+23−24
1 May 20264800
24 Apr 202648+21−21
17 Apr 20264800
10 Apr 202648+19−15
3 Apr 20264400

Sector shifts of 10 points or more

6 such shifts in 170 rebalances.

Show the latest six rebalances, what moved
  1. Other, not yet mapped +20 pts, Metals & Mining −11 pts
  2. Capital Goods +15 pts
  3. Power & Utilities +10 pts
  4. Other, not yet mapped −13 pts
  5. Other, not yet mapped −16 pts
  6. Other, not yet mapped −11 pts

Equity sleeve, between two consecutive lists.

Get the next rebalance by email

The names in and out, on the morning TotalMarket Hybrid rebalances. Every 2 weeks. Free, one click to stop.

Risk metrics

TotalMarket Hybrid against the Nifty 50

Risk and efficiency figures, model, back tested, against the Nifty 50
MetricTotalMarket HybridNifty 50
Sharpe ratio1.770.73
Sortino ratio1.690.70
Calmar ratio1.970.58
Volatility, a year21.55%14.04%
Max drawdown−21.82%−16.92%
Best week+8.10%+6.36%
Worst week−10.54%−6.33%
Weeks up62.84%57.47%
Average up week+2.51%+1.49%
Average down week−2.27%−1.57%

Model, back tested, after charges. Weekly, rolling 5 years to 27 Apr 2026; Nifty 50 over the same window.

Risk band

Moderate, Low to Very High

Deepest model fall
−21.82%
Time horizon
5 years or longer. Drawdowns of 22% have happened in the backtest and can happen again. Capital you might need within 12 months should not be here.
Walk the risk band

Card figures: Model, back tested. As of 27 Apr 2026. Take the risk profile to find your band.

Methodology

How it works

  1. 1
    Universe

    Start from the Nifty Total Market, filtered to stocks priced under ₹5,000. The equity sleeve sits inside a multi asset frame with debt.

  2. 2
    Rank

    Score every stock by a risk adjusted momentum composite over several look backs.

  3. 3
    Select

    Hold the top 51 equity names plus the fixed debt sleeve. Equity is equal weighted within its sleeve; the sleeve weights are fixed.

  4. 4
    Rebalance

    Every 2 weeks the model reruns: names out of the top 51 are sold, new entrants bought, and the full list is published.

Configuration

Universe
Nifty Total Market (max 5000)
Sleeves
Equity 80, debt 20
Holdings
51
Rebalance
Every 2 weeks, 26 a year
Max stock price
₹5,000
Benchmark
Nifty 50 (charts: Nifty 50 TRI CAGR line)
Back test from
7 May 2021
Metrics window
Rolling 5 years
Prices
NSE BhavCopy, after brokerage, STT, exchange charges and GST
Written for
Investors who want a balanced equity tilt with a built-in volatility cushion

Why TotalMarket Hybrid

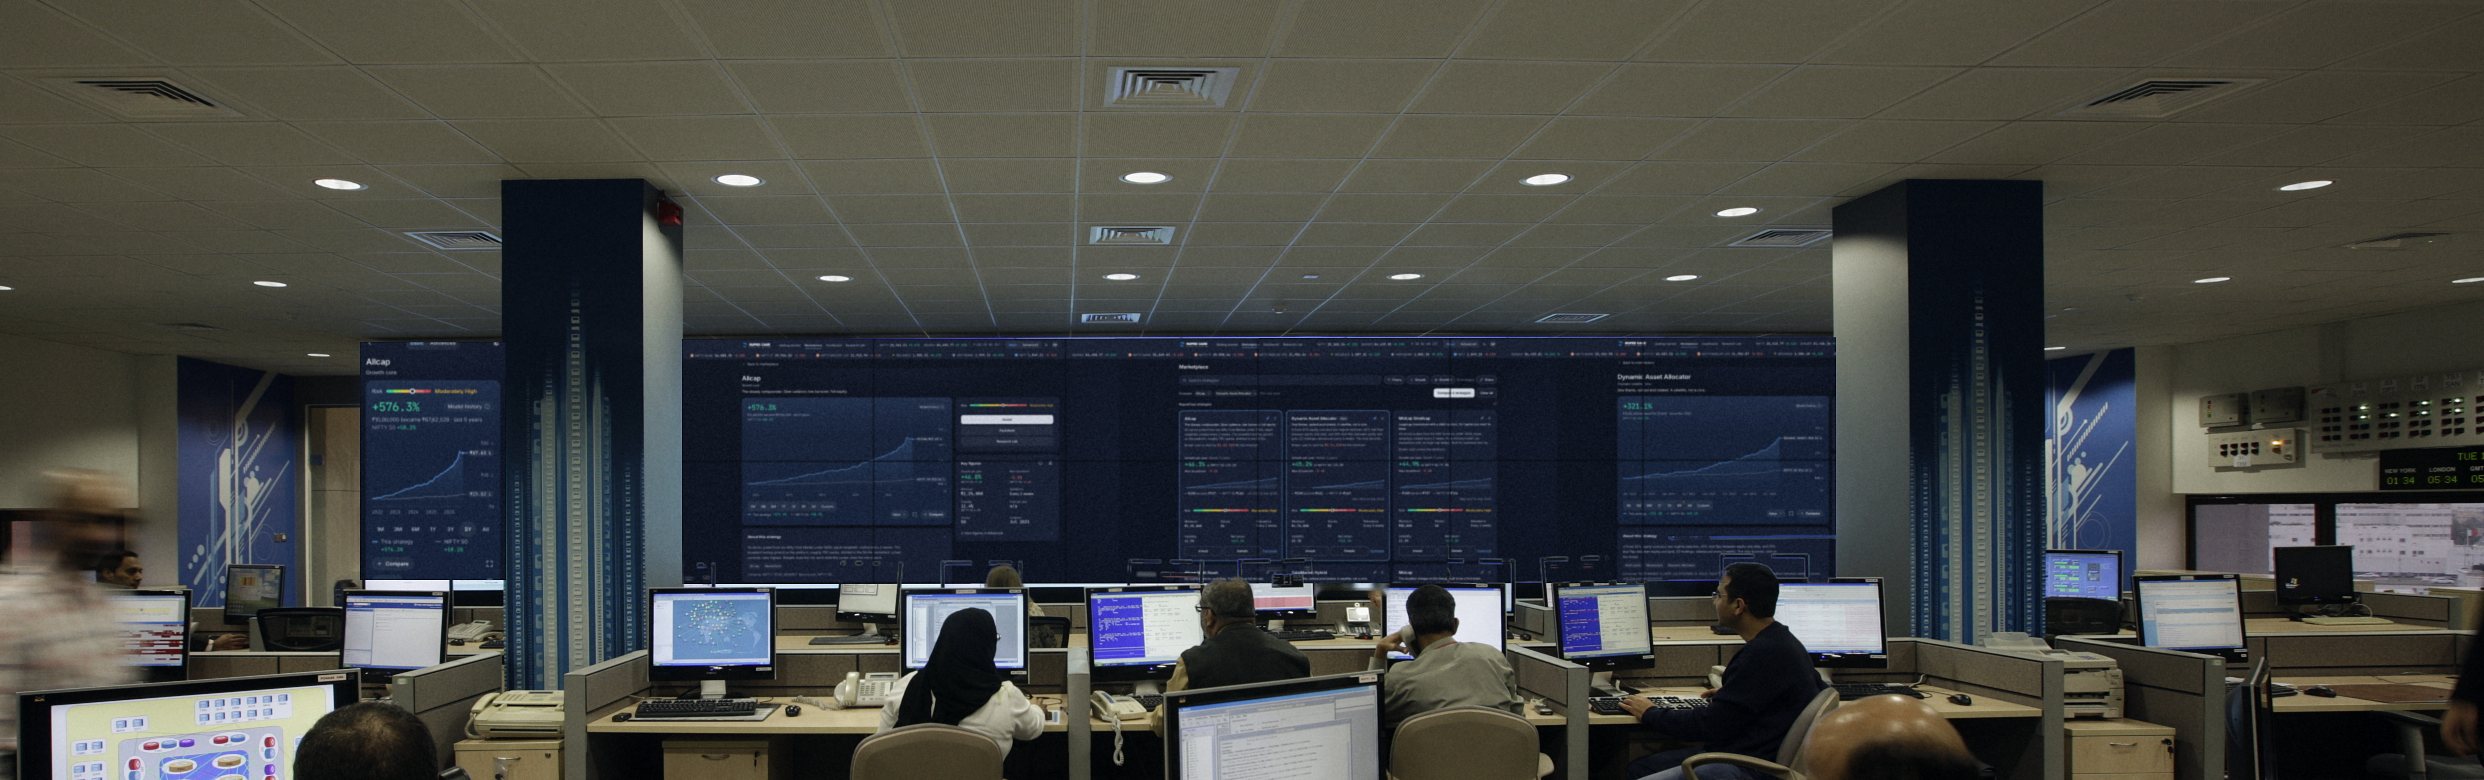
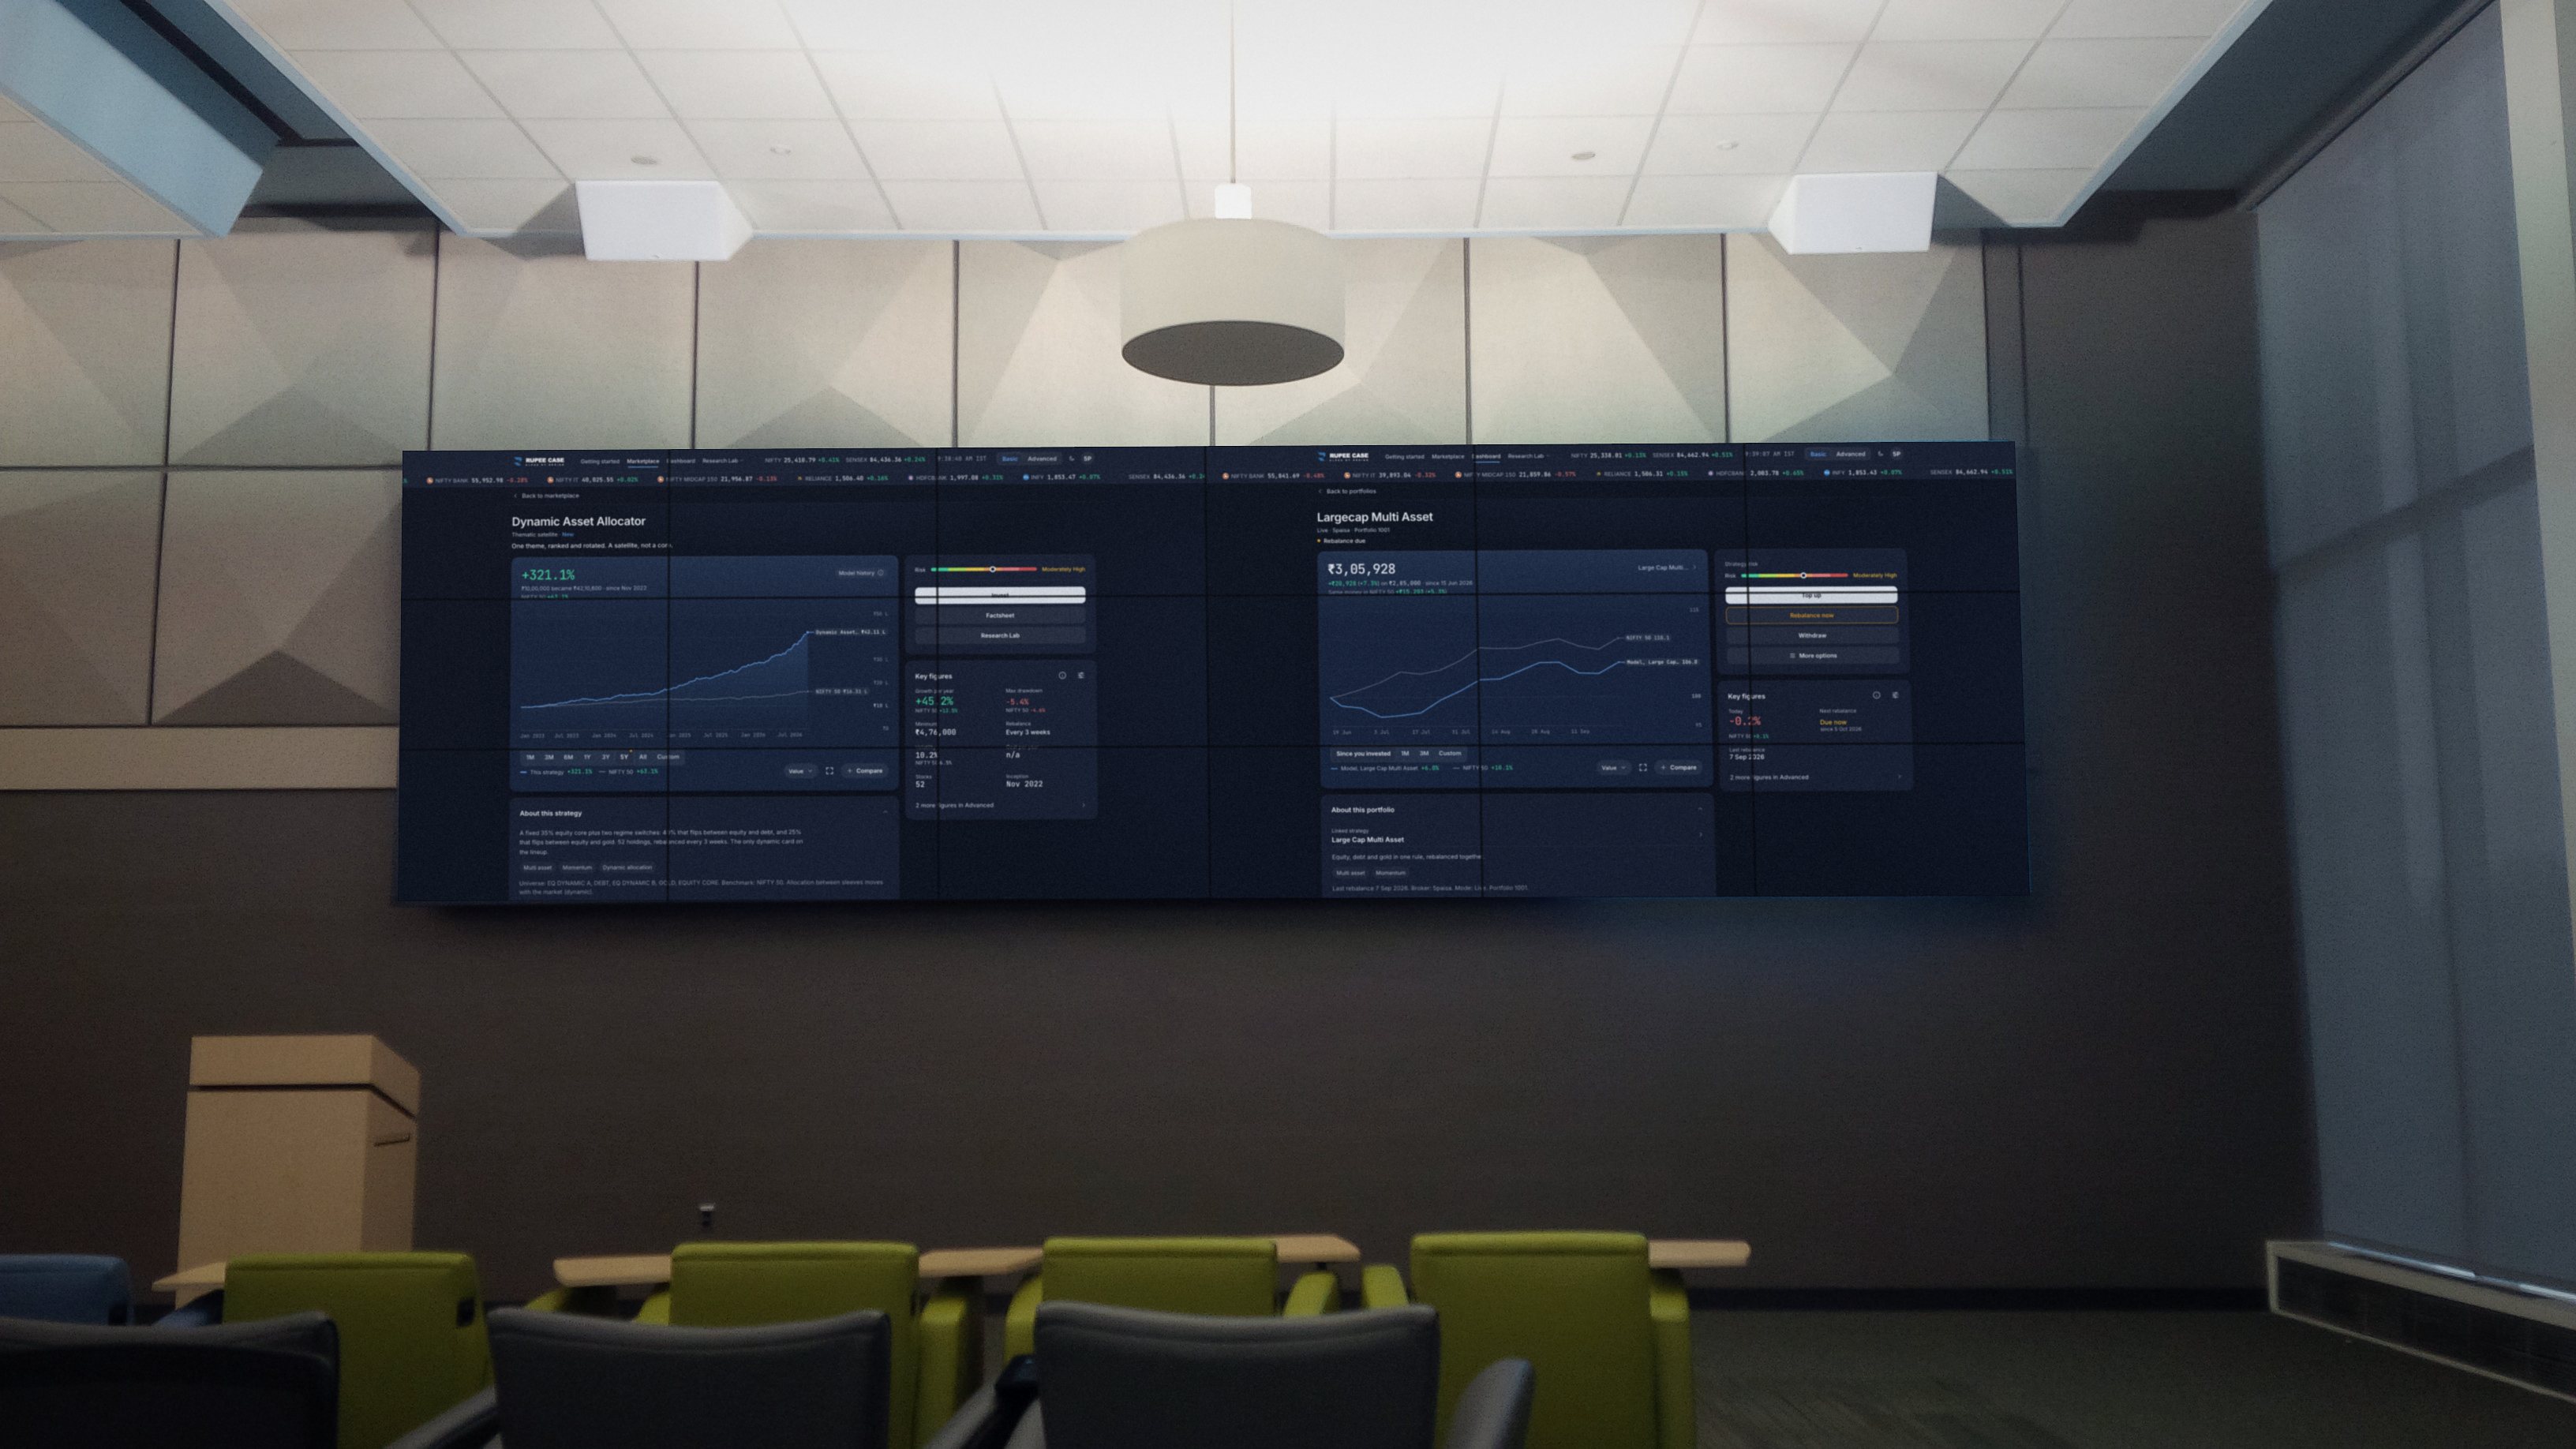
An institutional operations floor seen from behind the desks, with RupeeCase strategy screens across the video wall
An operations floor, RupeeCase on sample data
  • Broad-market momentum with a debt-only defensive overlay
  • 20% LiquidCase cushion without gold complexity
  • Same 50-stock engine as the multi-asset twin, one fewer moving part
  • For investors who want equity plus debt and nothing else
Read 4 more paragraphs, 141 words

The gold-free version of Allcap Multi Asset. Same 50-stock equity sleeve and same Nifty Total Market universe under 5000, but the 10% gold sleeve is folded into debt for a 20% LiquidCase cushion. Rebalance every 2 weeks.

The equity engine is identical to the multi-asset twin. What changes is the character of the cushion: all of it earns like debt, none of it hedges like gold.

This is not the multi-asset card. It is the simpler sibling. Same equity engine, same cost structure, but the gold inflation hedge is gone, and with it goes one moving part.

For an investor who explicitly does not want gold exposure, a simpler profile with no commodity holding and one fewer position to track, this is the card to pick. For an investor who does want the hedge, Allcap Multi Asset is the better trade.

A description, not a recommendation. Decide your own allocation, or ask a SEBI registered investment adviser.

How the rule was built

Machine learning tested the signals, the number of names and the cadence out of sample. The rule that ships is frozen and published: a fixed, readable algorithm, not a black box.

The engine and the audit trail

Learn the mechanics

Free Learn modules, no sign up.

Costs

One fee per rebalance

0.2%of traded value, charged only when a rebalance trades

No subscription, AUM or performance fee; broker charges are separate. Fee calculator Pricing

A year on the minimum

Minimum capital
₹2,81,000
Rebalances, year to 8 May 2026
53
Traded, about
16.7 timesthe portfolio
Platform fee a year, about
₹9,3903.3% of capital

Estimate from the model rebalance record at 0.2% of traded value; weight resets and broker charges excluded.

Costs inside the back test

Gross return
+586.00%before costs
Estimated costs
−86.95 ptsbrokerage, STT and taxes
Net return
+499.05%after costs
Nifty 50, same window
+59.62%cumulative

Model, back tested, cumulative, rolling 5 years to 27 Apr 2026. Net is gross minus estimated costs.

RupeeCase is a technology platform, not a fund, a PMS or a SEBI registered investment adviser. Model, back tested. As of 27 Apr 2026. Model figures are after estimated charges and are not actual client returns. Past performance does not guarantee future returns; capital can be lost.

Invest, the walkthrough

Allcap, model history after charges. Model, back tested. Not a promise of future returns.
Steps in this video
  1. Allcap, model history after charges. Model, back tested. Not a promise of future returns.
  2. The Invest bar shows the minimum for this strategy.
  3. Invest opens the sheet with the minimum as the amount.
  4. Type any amount at or above the minimum.
  5. Use minimum puts the minimum back.
  6. Practice is chosen first. It follows the strategy with no real broker order.
  7. Live shows the cash at your broker.
  8. Nothing is sent until you accept the consent text and press Invest now.
  9. Each portfolio shows its mode, broker and status at the top.

04Questions

Before you
commit capital.

What is the TotalMarket Hybrid strategy?

50 stocks, 20% debt, no gold. Fortnightly rotation. It selects the top 51 momentum names from Nifty Total Market (max 5000) and rebalances every 2 weeks.

What is the minimum investment for TotalMarket Hybrid?

About ₹2,81,000 (as of 8 Aug 2026), enough to hold one share of every name in the book at recent prices. The figure moves with the prices of the holdings.

How does TotalMarket Hybrid compare to the Nifty 50?

TotalMarket Hybrid shows a model CAGR of 39.53% against 9.80% for the Nifty 50 TRI CAGR line (Jan 2021 to Jul 2026), with a Sharpe ratio of 1.77. Model, back tested. As of 27 Apr 2026. Past performance does not guarantee future returns.

What is the worst drawdown TotalMarket Hybrid has experienced?

21.82% peak to trough in the model record. The deepest period ran 406 days, from 20 Dec 2024 to 30 Jan 2026. Model, back tested. As of 27 Apr 2026. Drawdowns of similar size can happen again, so size the position for it.

What are the fees on TotalMarket Hybrid?

0.2% of traded value per rebalance. No subscription, no AUM fee, no performance fee. About 3.3% of capital a year at 0.2% of traded value, from the published rebalance record: 53 rebalances in the year to 8 May 2026, about 16.7 times the portfolio traded (sales and purchases). Weight resets and broker side charges (brokerage, STT, exchange charges, GST) are not included. Turnover varies year to year. On the minimum capital of ₹2,81,000 that is about ₹9,390 a year, an estimate from the model record, not a promise.

Can I exit TotalMarket Hybrid at any time?

Yes. No lock-in. Holdings sit in your own broker demat account and you can sell any name on any market day. Switching strategies or pausing the rebalance is a one-click action on the platform.

Ready when you are

TotalMarket Hybrid

39.53% CAGR, model, back tested. About ₹2.81L to start. Every 2 weeks, you approve each one.

0.2% of traded value per rebalance. No AUM fee, no lock in. Line: the model record after charges, as of 27 Apr 2026. Not a promise of future returns.