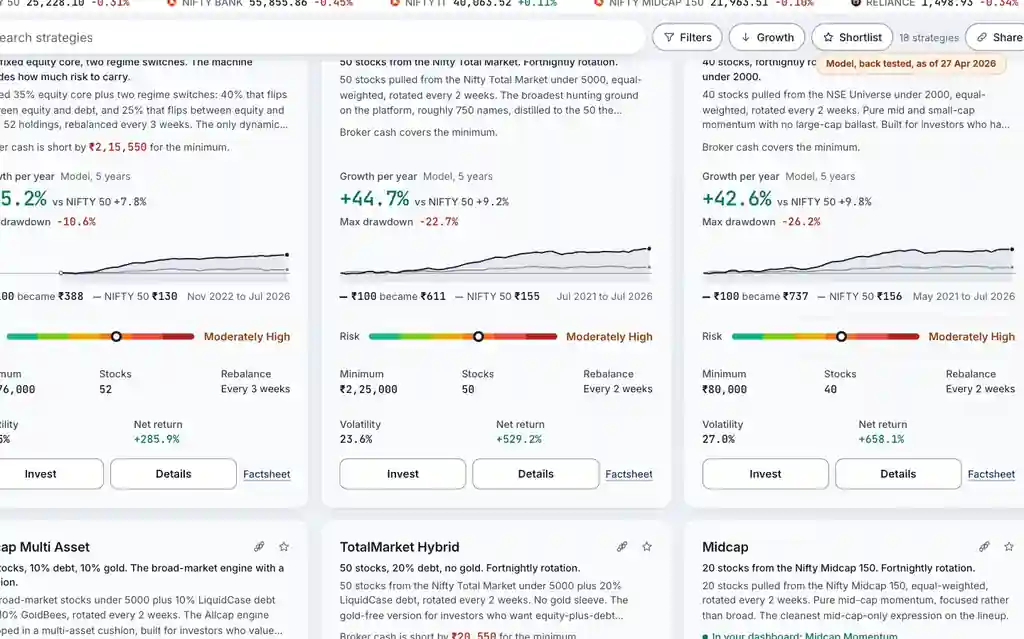
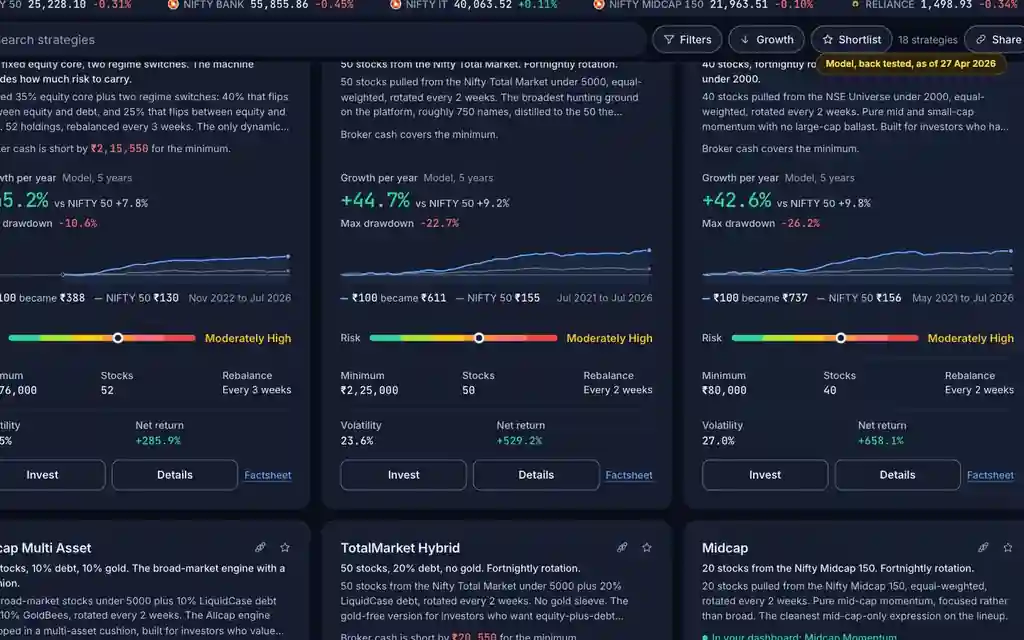
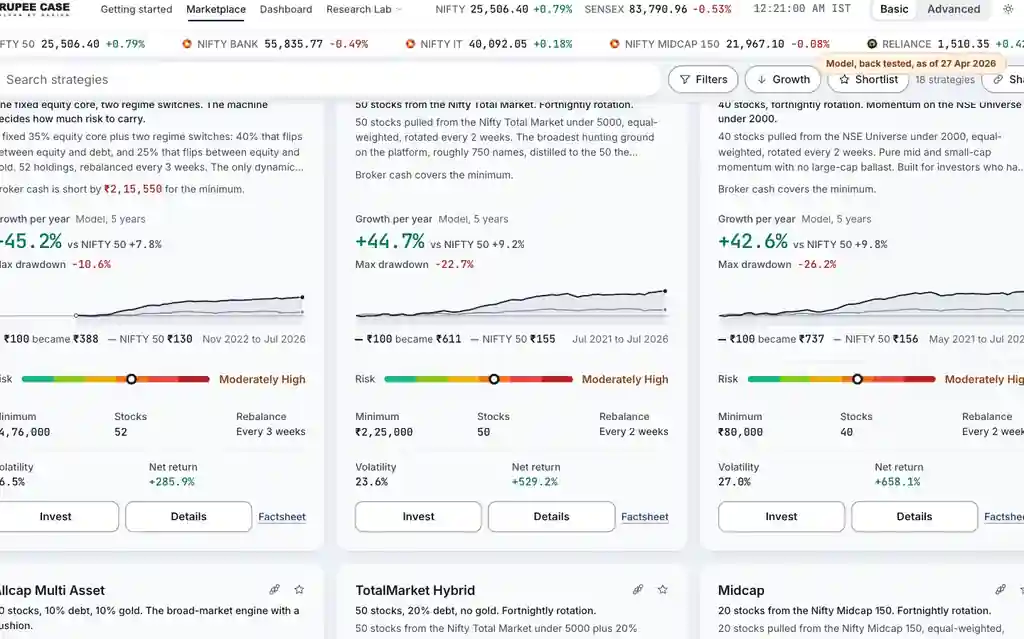
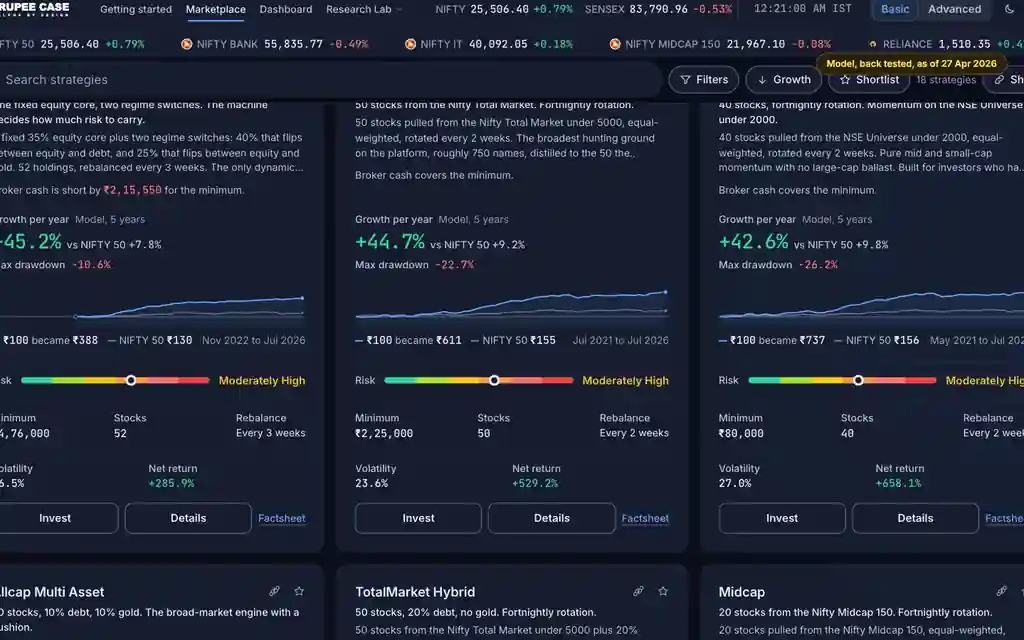
Where it is
ScreenStrategy (key figures, Risk tab)Advanced
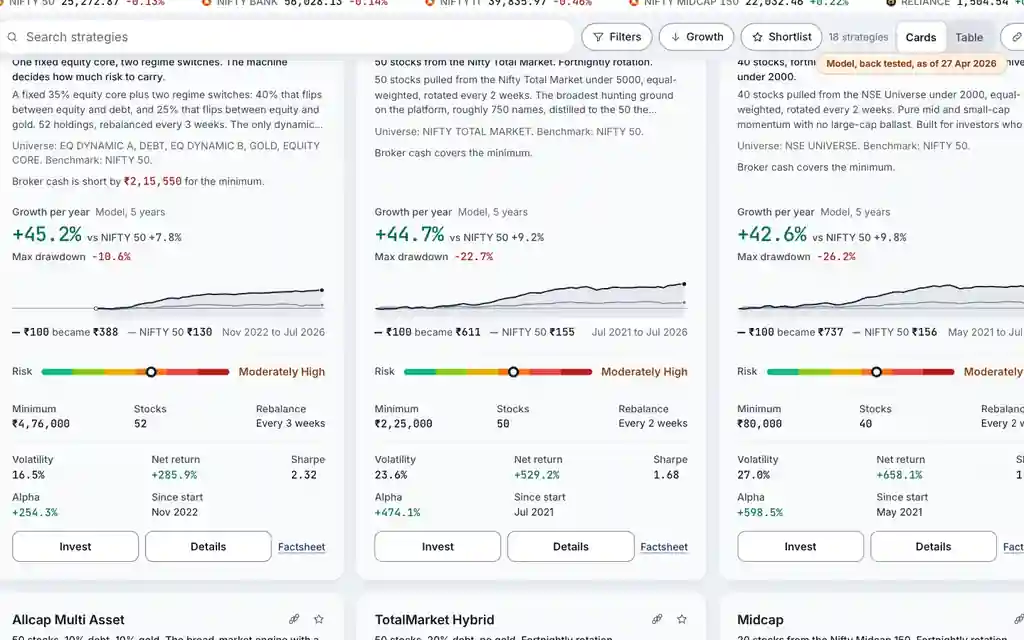
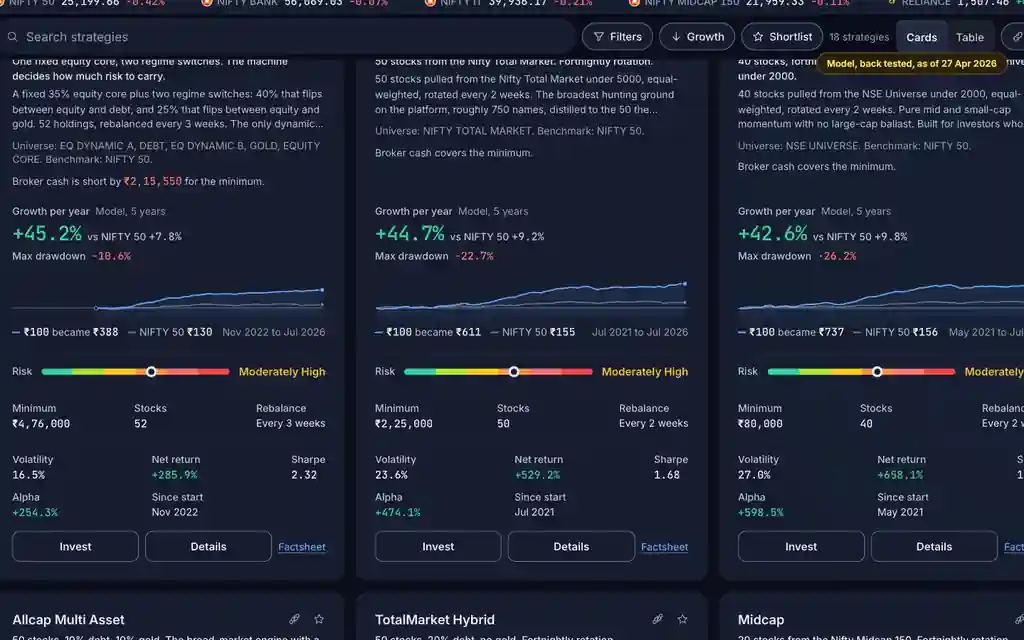
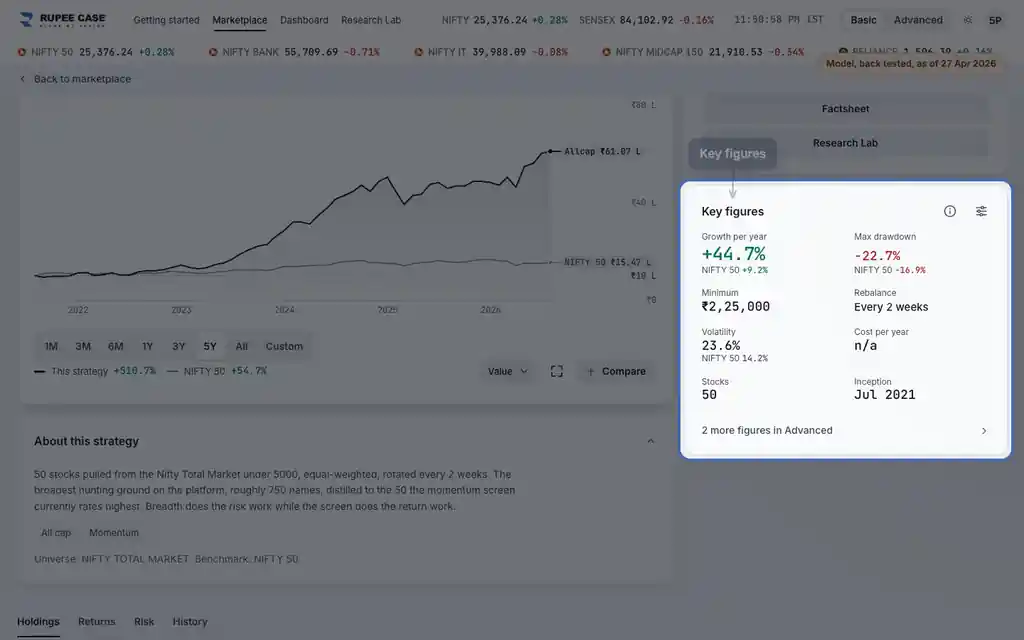
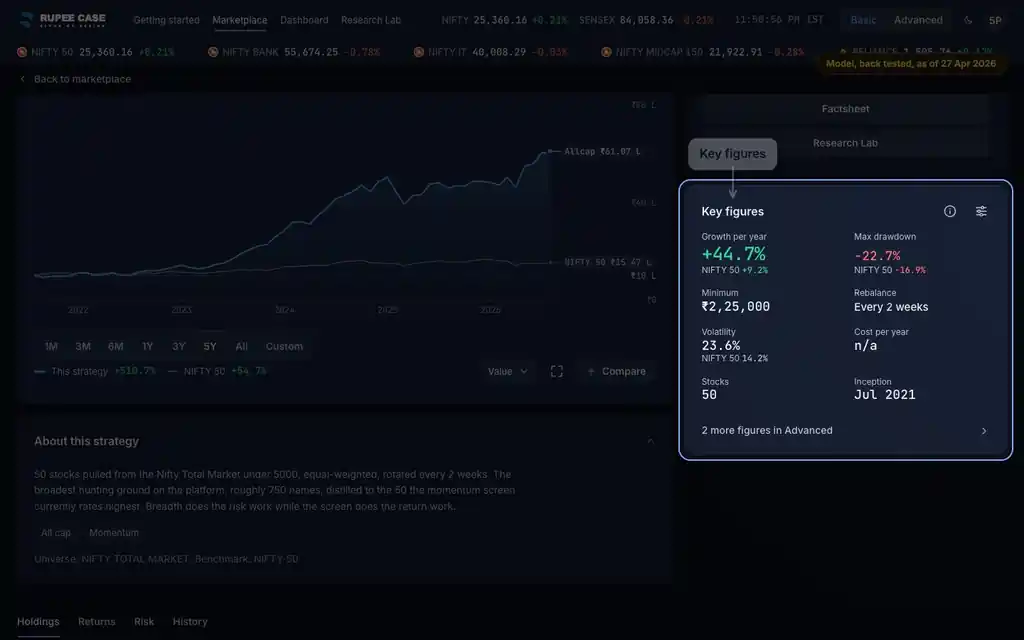
Volatility is on the cards and key figures (always in Basic). Sharpe is on cards and key figures in Advanced, and in the Risk figures card.
What it means
Volatility measures how much the model's weekly returns swung around their average, scaled to a year. Sharpe divides the average weekly return above a 6 percent a year risk free rate by that swing. A higher Sharpe means more return for each unit of swing in the history.
The formula
Volatility: standard deviation of weekly returns, times the square root of 52. Sharpe: average weekly return less the weekly risk free rate, over that deviation, times the square root of 52.
Volatility = standard deviation of weekly returns x square root of 52
Sharpe = (average weekly return - 6% / 52) / standard deviation of weekly returns x square root of 52
Worked example
Example only
- Average weekly return 0.5%, weekly sd 3%
- Volatility: 3% x 7.21 = 21.6% a year
- Sharpe: (0.5% - 0.115%) / 3% x 7.21 = 0.92
How to read it
- The app's tip: above 1 is good, above 2 is rare.
- Compare volatility with the NIFTY 50 figure under it.
- Two strategies with the same growth: the lower volatility one had the smoother path.
Watch out
- The risk free rate is fixed at 6 percent a year.
- Volatility counts rises and falls alike; Sortino (Advanced) counts falls only.
- Weekly data, model history: not a forecast.
Transcript
The video has no sound. These are its on screen captions, chapter by chapter.
- 0:00Where it is. Volatility is in the key figures in Basic and Advanced.
- 0:19What it means. Volatility: standard deviation of weekly returns, times the square root of 52. Sharpe: average weekly return less the weekly risk free rate, over that deviation, times the square root of 52.
- 0:25Worked example. Worked example, example only: Average weekly return 0.5%, weekly sd 3%. Volatility: 3% x 7.21 = 21.6% a year. Sharpe: (0.5% - 0.115%) / 3% x 7.21 = 0.92.
- 0:31How to read it. The Risk tab lists both with the other risk figures.
- 0:44Watch out. Watch out: The risk free rate is fixed at 6 percent a year. Volatility counts rises and falls alike; Sortino (Advanced) counts falls only. Weekly data, model history: not a forecast.
Terms in this tutorial
- Sharpe ratioRisk-adjusted return.
- volatilityHow much returns fluctuate.
- standard deviationStatistical measure of dispersion.
- Sortino ratioLike Sharpe but only penalises downside volatility.