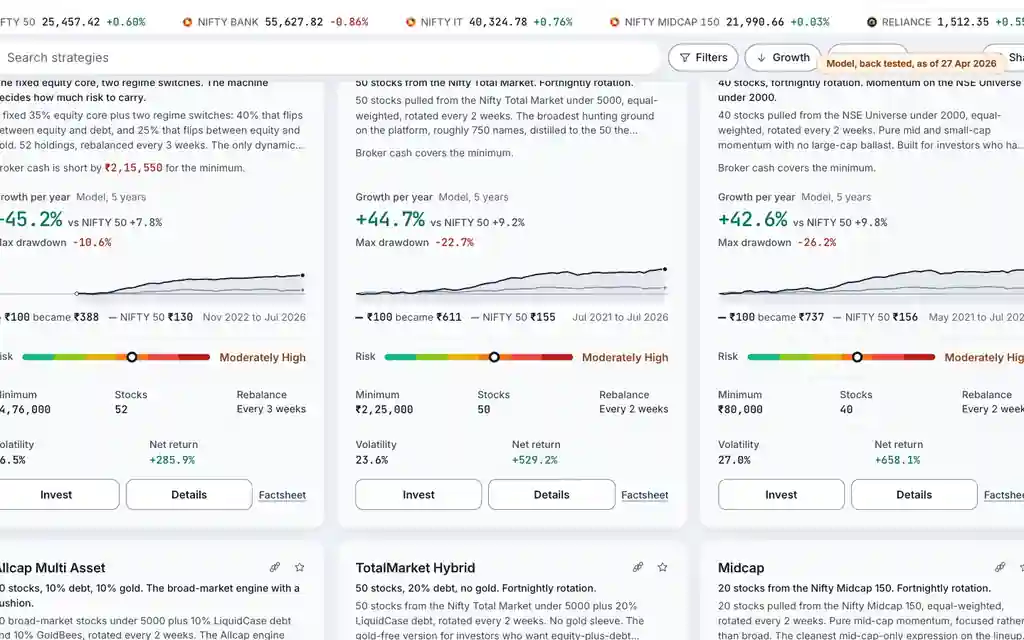
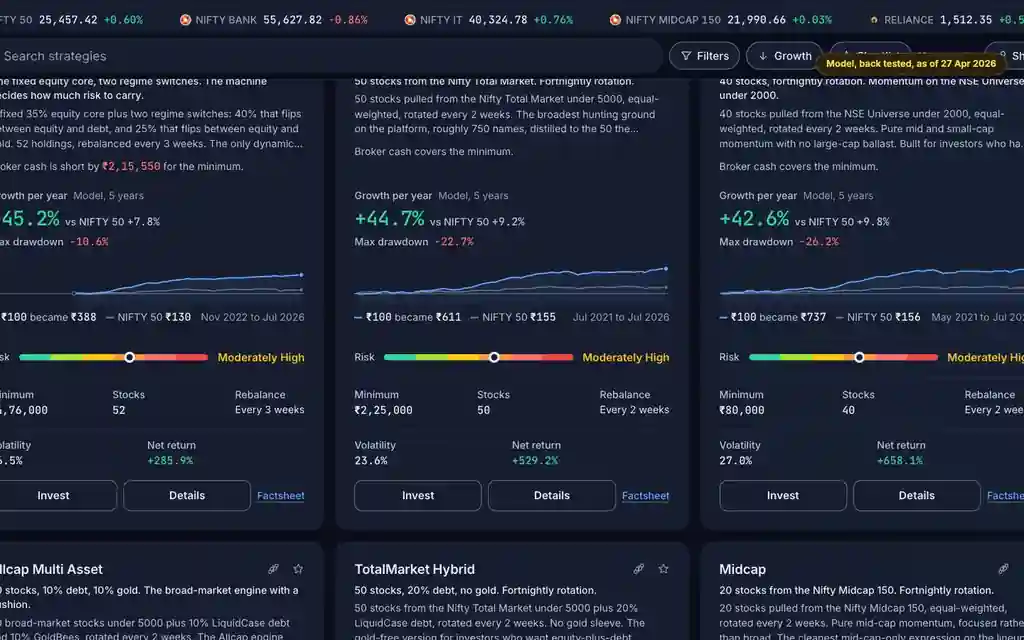
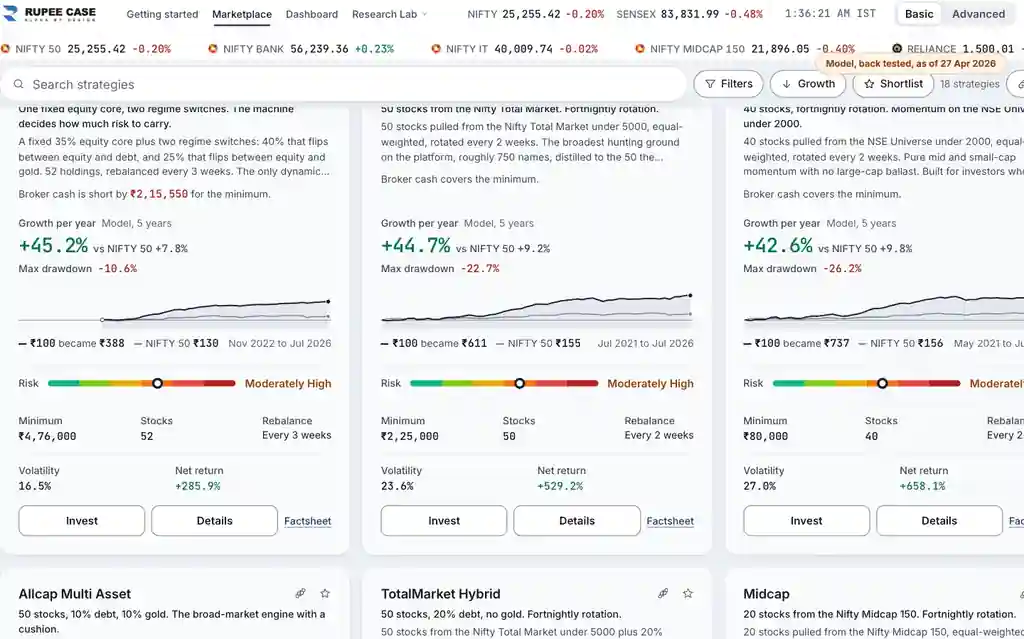
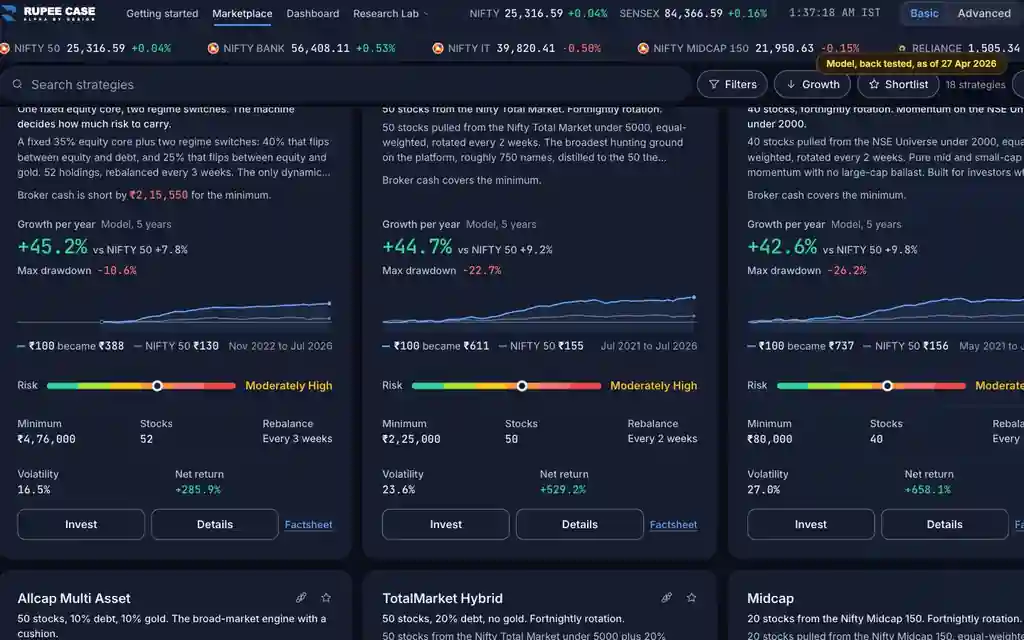
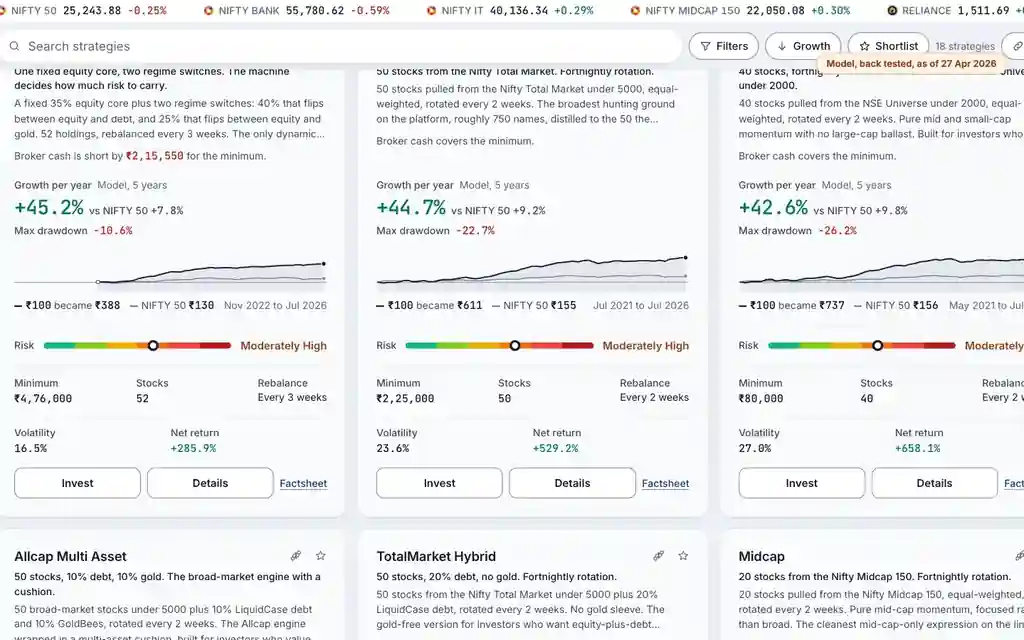
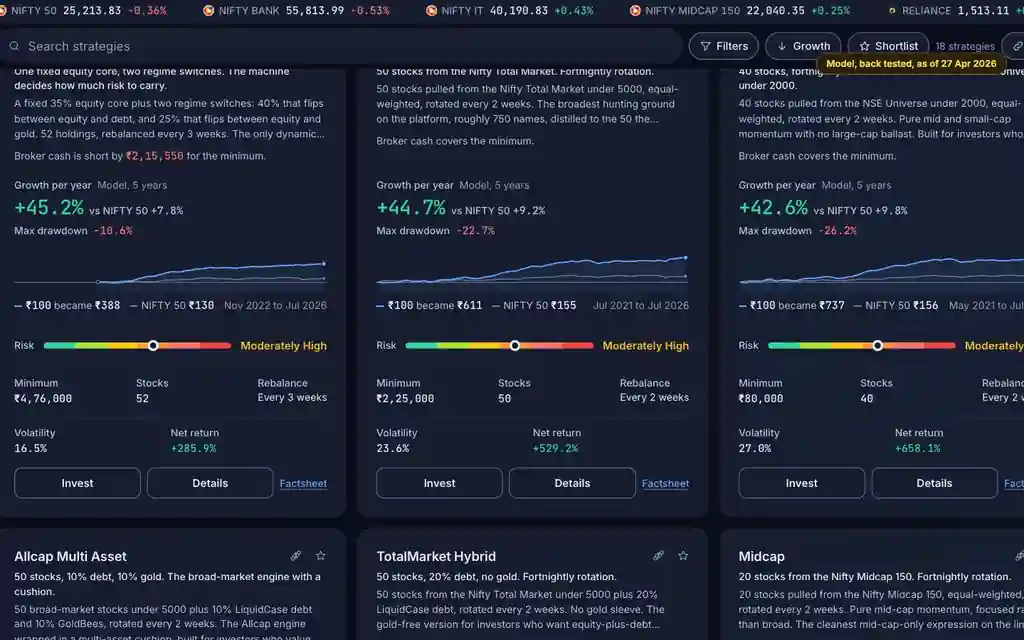
Where it is
ScreenMarketplace and StrategyBasic
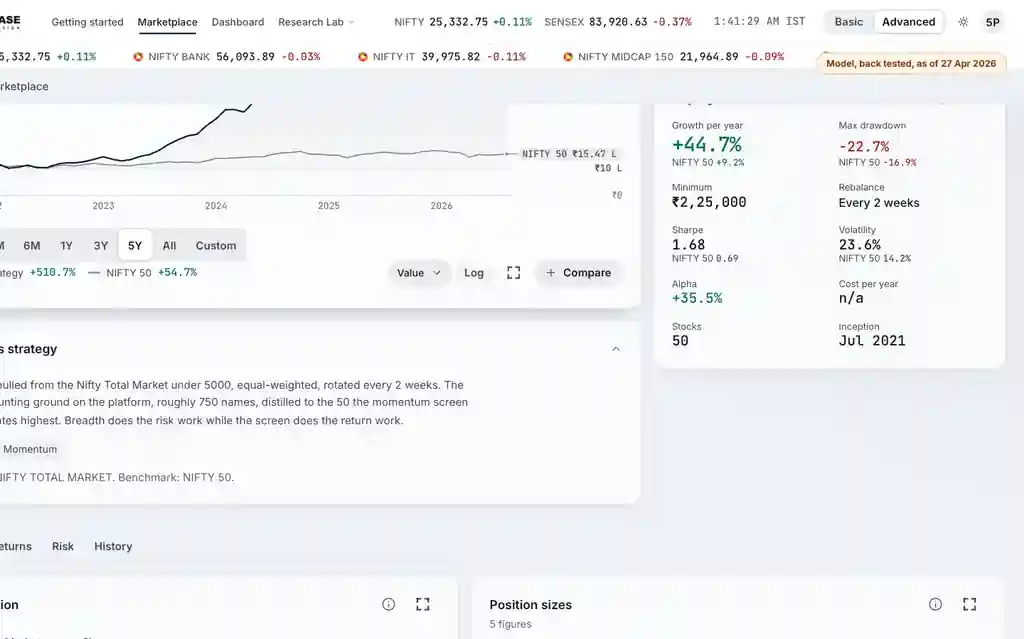
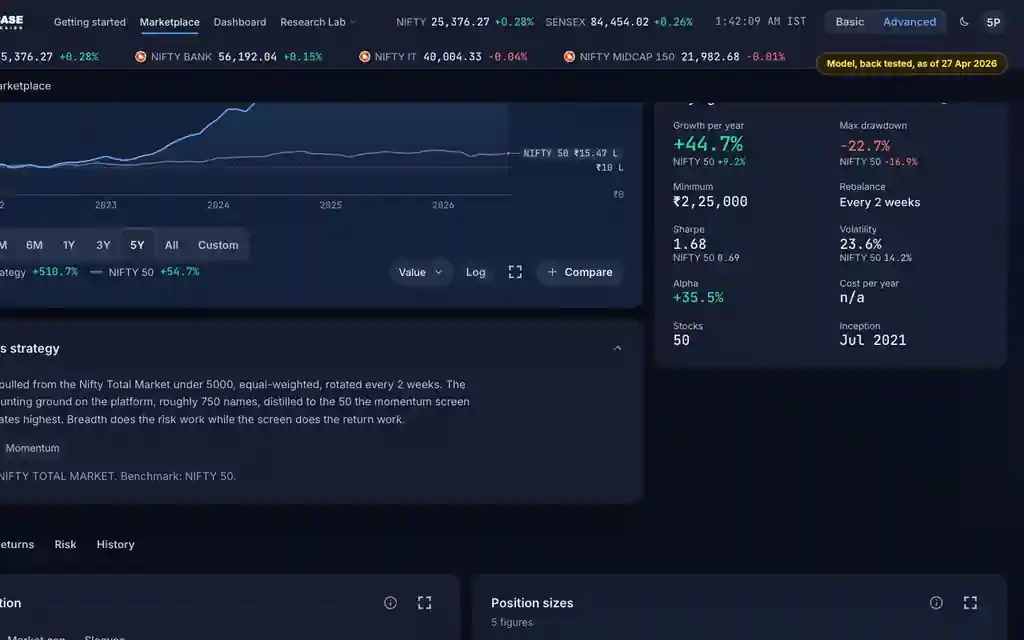
On every Marketplace card, in the strategy key figures and in the Risk tab (Drawdowns card). Always shown in Basic.
What it means
Max drawdown is the largest percentage fall from a high point of the model to a later low, before a new high. It says how deep a bad stretch went in the history. On the card it covers the full history; on the strategy page it covers the chosen period.
The formula
At every week, compare the value with the highest value so far. The deepest of those falls is the max drawdown.
Drawdown each week = value / highest value so far - 1
Max drawdown = the lowest of those weekly drawdowns (weekly model history)
Worked example
Example only
- The model rises from Rs 10,00,000 to Rs 15,00,000
- It then falls to Rs 12,00,000 before a new high
- 12,00,000 / 15,00,000 - 1 = -20% max drawdown
How to read it
- Compare it with the NIFTY 50 figure under it, for the same period.
- Ask whether you could hold through a fall that deep.
- The Drawdowns card shows how long each fall lasted.
Watch out
- History can be beaten: a future fall can be deeper.
- Weekly data misses falls inside a week.
- "Max drawdown length" is the length of the deepest fall, not the longest one.
Transcript
The video has no sound. These are its on screen captions, chapter by chapter.
- 0:00Where it is. Each card shows the deepest fall in the model history.
- 0:18What it means. At every week, compare the value with the highest value so far. The deepest of those falls is the max drawdown.
- 0:24Worked example. Worked example, example only: The model rises from Rs 10,00,000 to Rs 15,00,000. It then falls to Rs 12,00,000 before a new high. 12,00,000 / 15,00,000 - 1 = -20% max drawdown.
- 0:30How to read it. The Risk tab draws every fall from the running high.
- 0:46Watch out. Watch out: History can be beaten: a future fall can be deeper. Weekly data misses falls inside a week. "Max drawdown length" is the length of the deepest fall, not the longest one.
Terms in this tutorial
- drawdownThe peak-to-trough decline during a specific period.
- volatilityHow much returns fluctuate.