Where it is
ScreenStrategyBasic
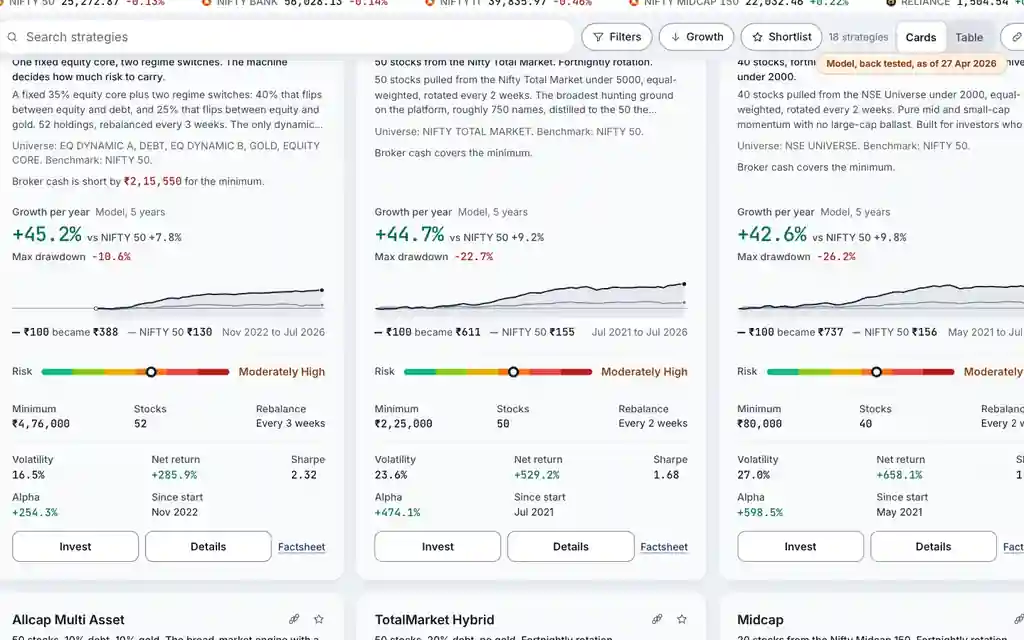
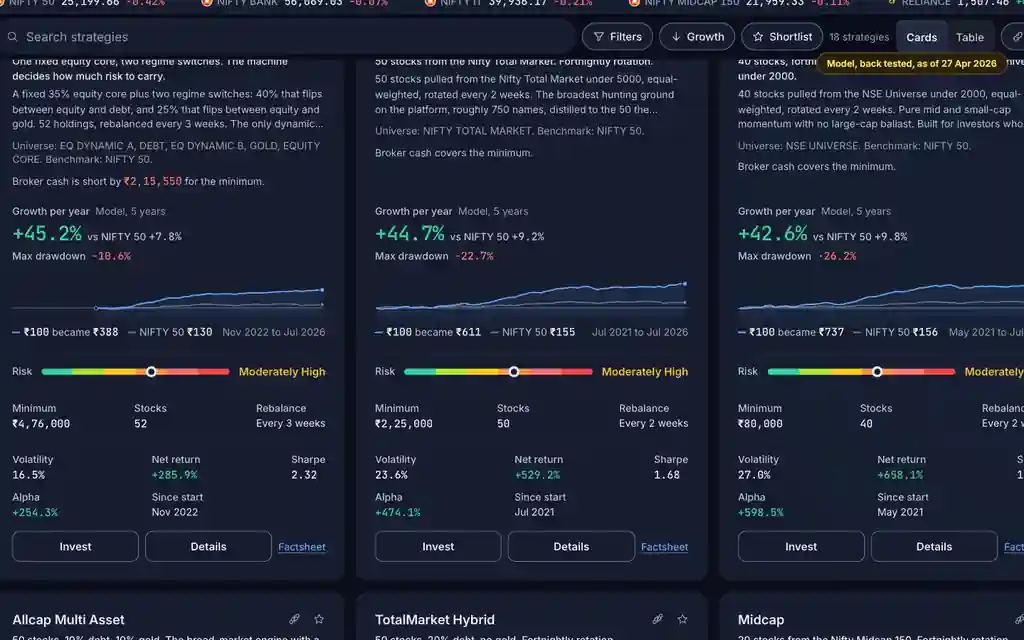
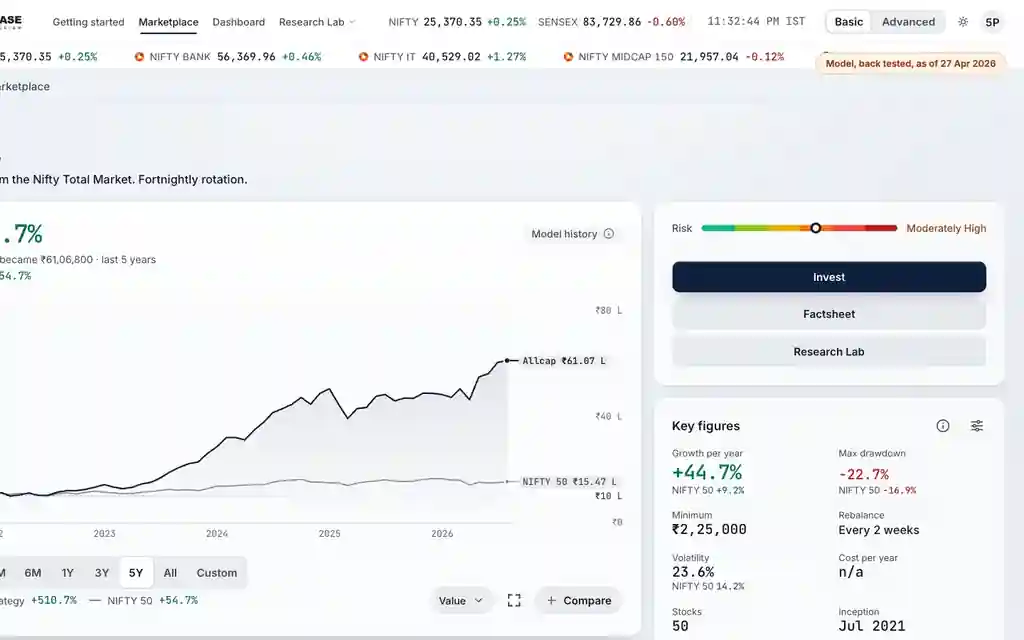
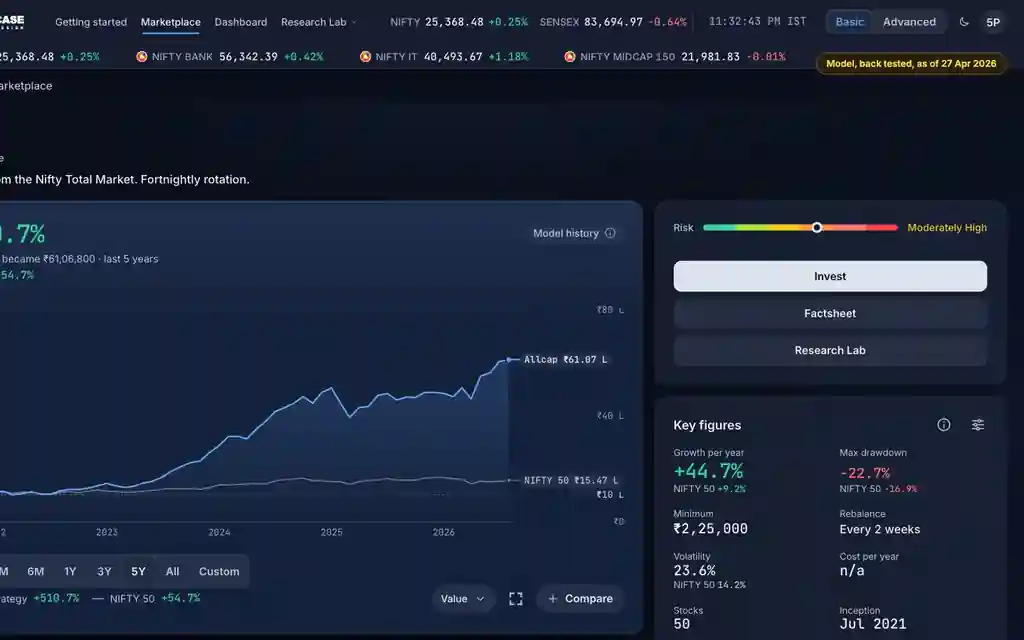
Under the hero on a strategy page (right column on desktop). Four lead figures, then "All N figures". Basic and Advanced.
What it means
The key figures card is worked out in the app from the weekly model history, over the period you chose and against the primary benchmark. It leads with four figures, by default Growth per year, Max drawdown, Minimum and Rebalance, and shows the benchmark twin under each shared figure. "All N figures" opens the rest; Customise chooses the lead four.
The formula
Each figure is recomputed for the chosen window; growth per year and alpha need at least a year, otherwise the card shows the return for the months there are.
Each figure = recomputed over the chosen period, against the primary benchmark
Lead four by default: Growth per year, Max drawdown, Minimum, Rebalance (change them in Customise)
Growth per year and alpha need a window of 1 year or more
Worked example
Example only
- Period 5Y: Growth per year 20%, NIFTY 50 10%
- Period 1Y: "Return, last year" replaces growth per year
- Lead four on a phone; "All 8 figures" opens the rest
How to read it
- The small line under a figure is the benchmark for the same window.
- Minimum, Rebalance, Stocks and Inception do not change with the period.
- The info button explains each figure and lets you pin it to Basic.
Watch out
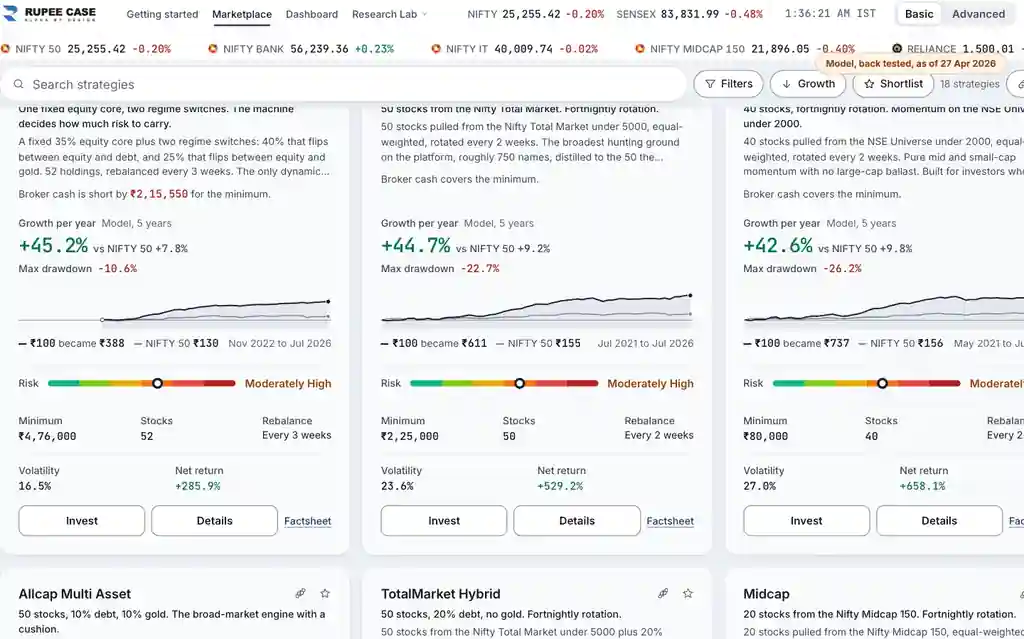
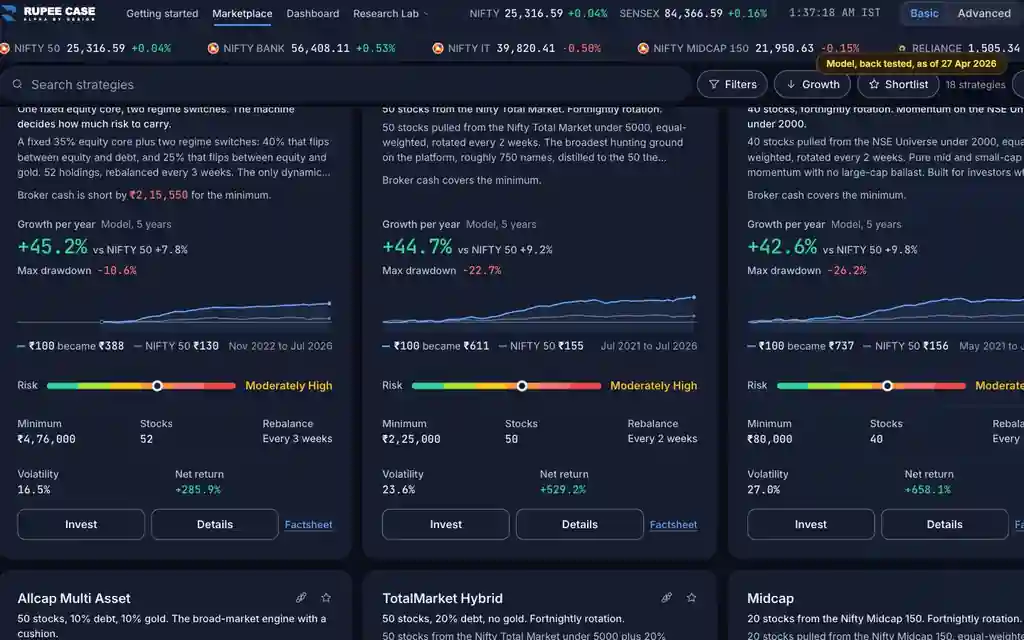
- Figures follow the period; Marketplace cards do not.
- Alpha here is the growth per year difference, not total return points.
Transcript
The video has no sound. These are its on screen captions, chapter by chapter.
- 0:00Where it is. Key figures sit under the hero, worked out for your period.
- 0:07What it means. Four lead figures come first. The rest are one tap away.
- 0:29Worked example. Worked example, example only: Period 5Y: Growth per year 20%, NIFTY 50 10%. Period 1Y: "Return, last year" replaces growth per year. Lead four on a phone; "All 8 figures" opens the rest.
- 0:35How to read it. The info button explains each figure on the card.
- 0:49Watch out. Watch out: Figures follow the period; Marketplace cards do not. Alpha here is the growth per year difference, not total return points.
Terms in this tutorial
- CAGRCompound Annual Growth Rate.
- drawdownThe peak-to-trough decline during a specific period.
- Sharpe ratioRisk-adjusted return.
- volatilityHow much returns fluctuate.