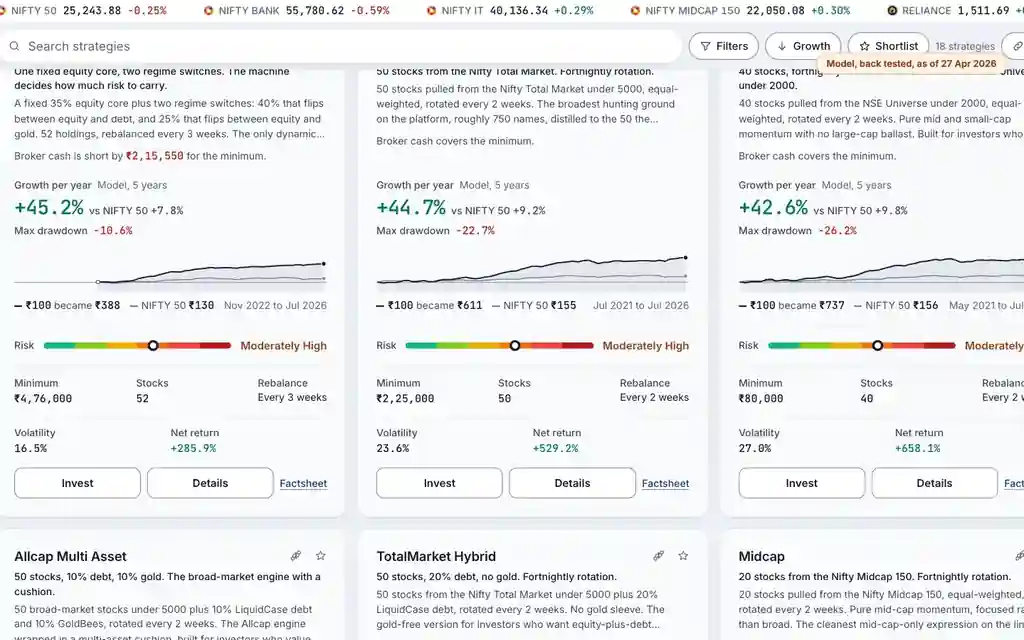
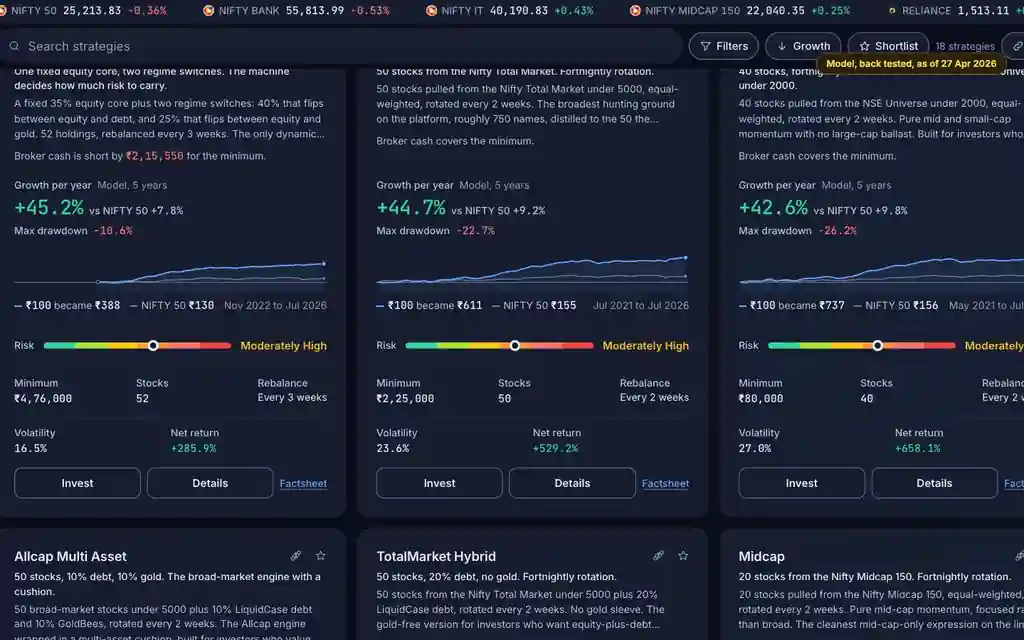
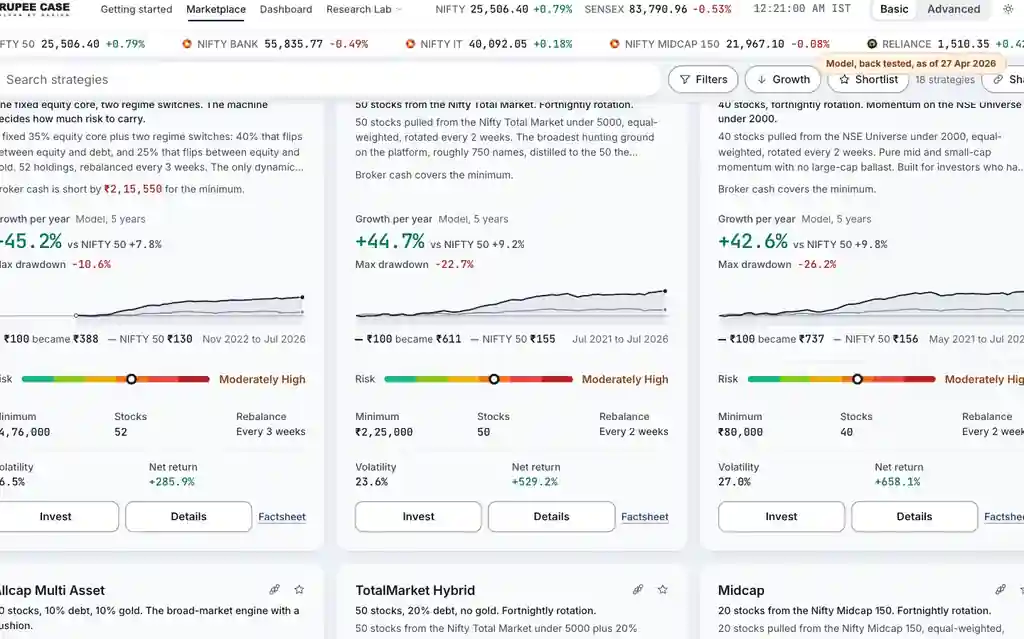
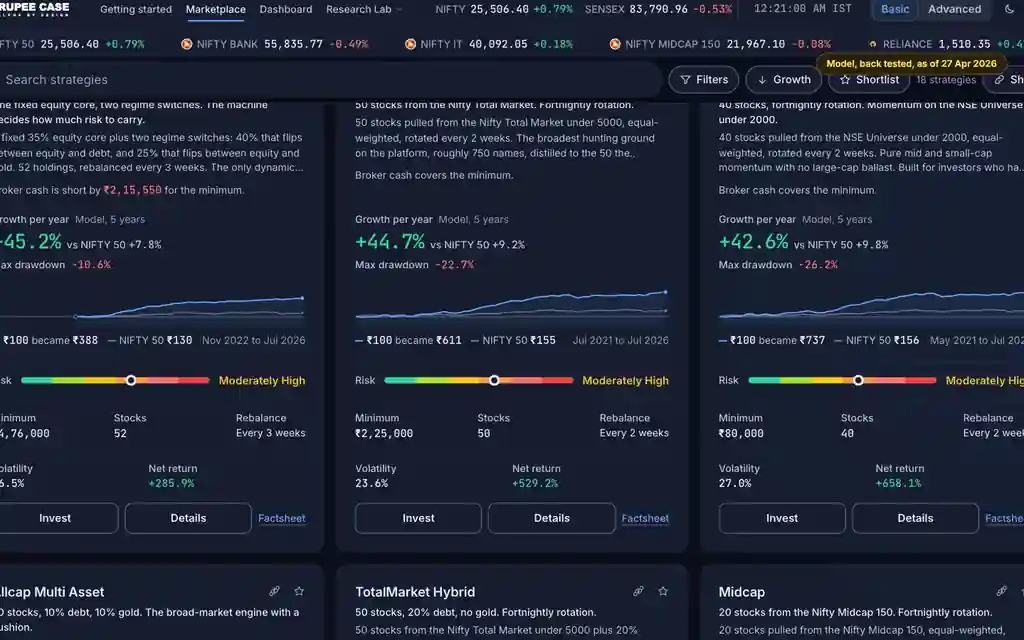
Where it is
ScreenMarketplace and StrategyBasic
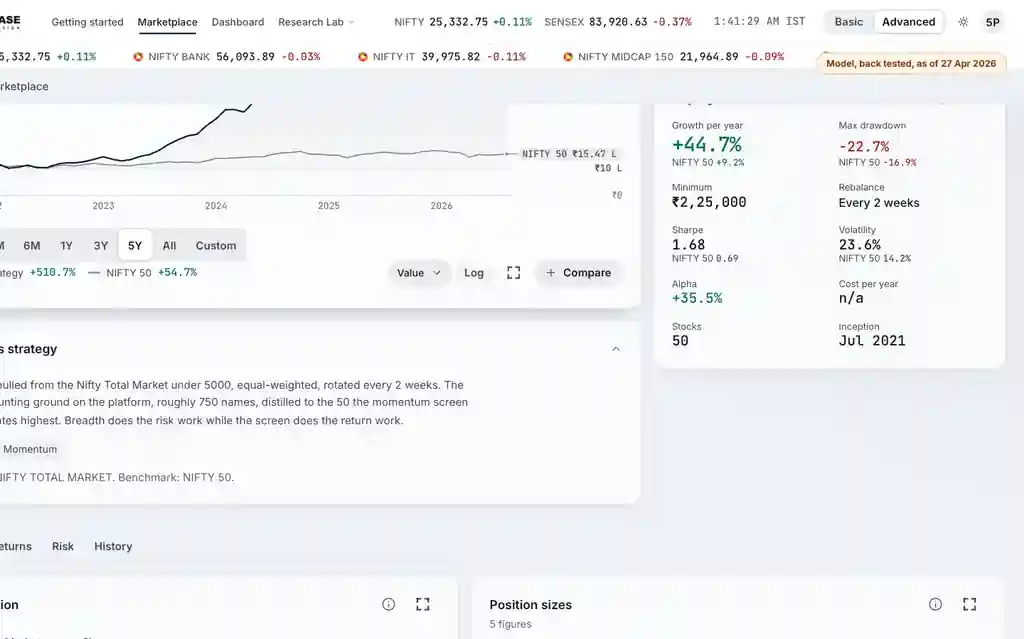
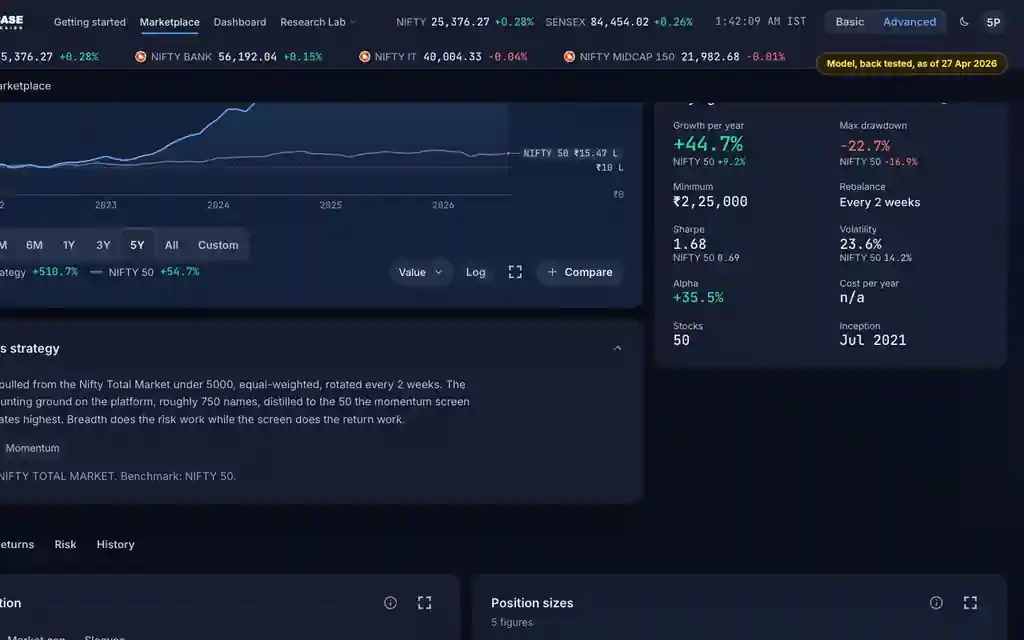
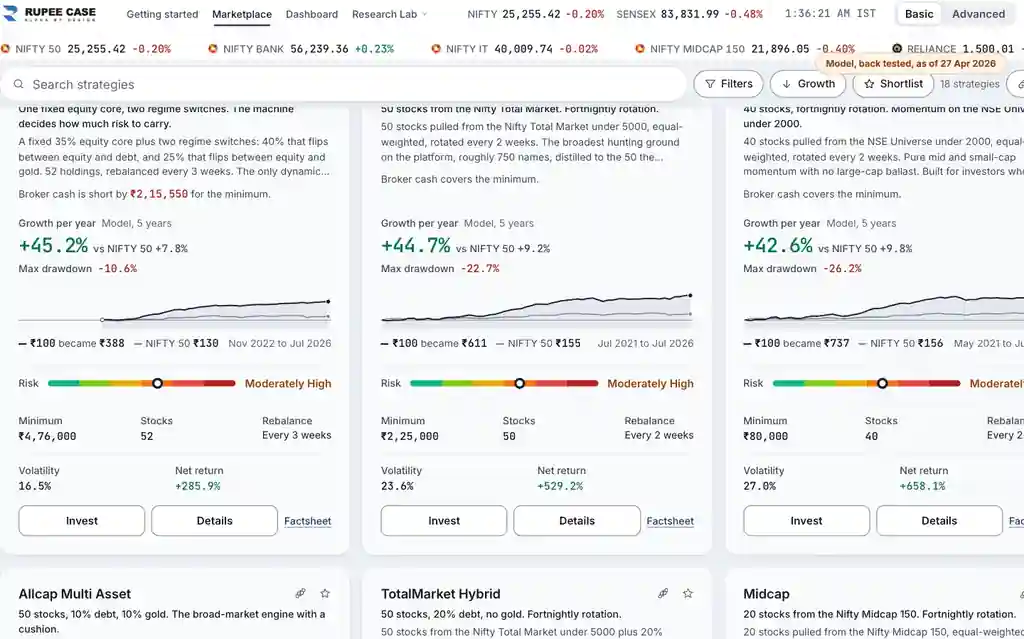
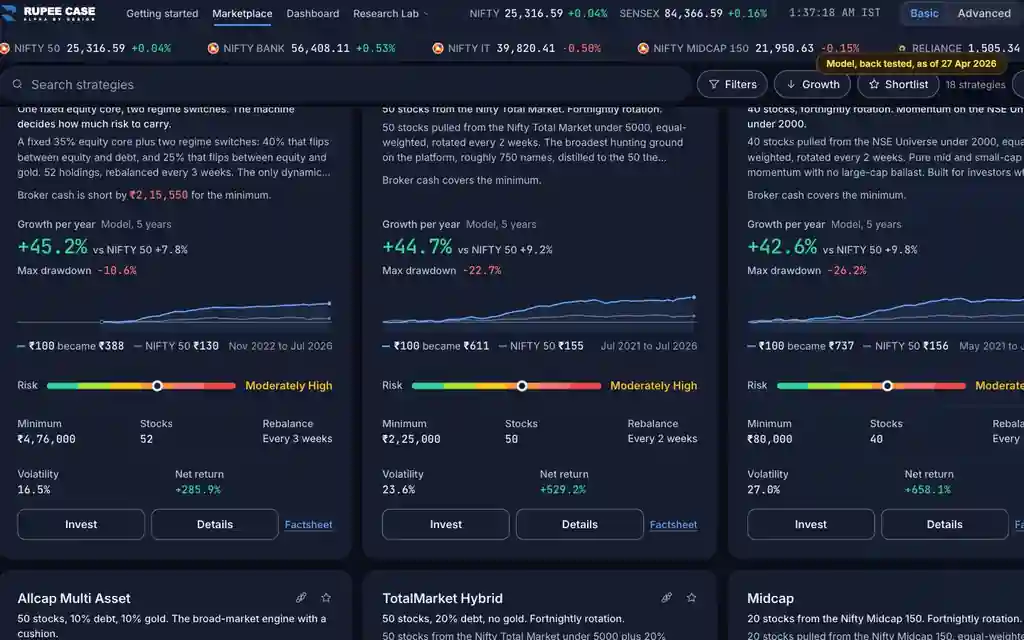
The coloured scale on each Marketplace card and at the top of the strategy page (side panel on desktop). Basic and Advanced.
What it means
The riskometer places a strategy on six steps: Low, Low to Moderate, Moderate, Moderately High, High, Very High. The server sets it from a score: how broad the stock universe is, how few stocks are held, how far past returns strayed from the benchmark, and whether there is a single asset class.
The formula
Add points for a broad universe, for few stocks, for returns far from the benchmark and for a single asset class. More points, higher step.
score = universe (NIFTY 50: 1 ... NSE universe: 4) + few stocks (5 or fewer: 4, 10 or fewer: 2, 20 or fewer: 1)
 + gap between gross and benchmark return (over 5 points: 1, 15: 2, 30: 3, 50: 4) + 1 if a single asset class
up to 2 Low, 4 Low to Moderate, 6 Moderate, 8 Moderately High, 10 High, above 10 Very High
Worked example
Example only
- Universe NIFTY 500: 3 points
- 50 stocks: 0 points; returns 40 points above the benchmark: 3
- Single asset: 1 point. Total 7: Moderately High
How to read it
- Low to Moderate steps suit a calmer path in the history.
- Moderately High and above went with deeper falls in the history.
- Read it with max drawdown and volatility, not alone.
Watch out
- The tip says "set by the strategy design", but past return gap also counts.
- An admin can override the level; "Not rated" means none is set.
- It is a scale for the model, not a check of your own risk profile.
Transcript
The video has no sound. These are its on screen captions, chapter by chapter.
- 0:00Where it is. The riskometer runs from Low to Very High.
- 0:17What it means. Add points for a broad universe, for few stocks, for returns far from the benchmark and for a single asset class. More points, higher step.
- 0:23Worked example. Worked example, example only: Universe NIFTY 500: 3 points. 50 stocks: 0 points; returns 40 points above the benchmark: 3. Single asset: 1 point. Total 7: Moderately High.
- 0:29How to read it. How to read it: Low to Moderate steps suit a calmer path in the history. Moderately High and above went with deeper falls in the history. Read it with max drawdown and volatility, not alone.
- 0:35Watch out. Watch out: The tip says "set by the strategy design", but past return gap also counts. An admin can override the level; "Not rated" means none is set. It is a scale for the model, not a check of your own risk profile.
Terms in this tutorial
- volatilityHow much returns fluctuate.
- drawdownThe peak-to-trough decline during a specific period.
- SEBISecurities and Exchange Board of India.