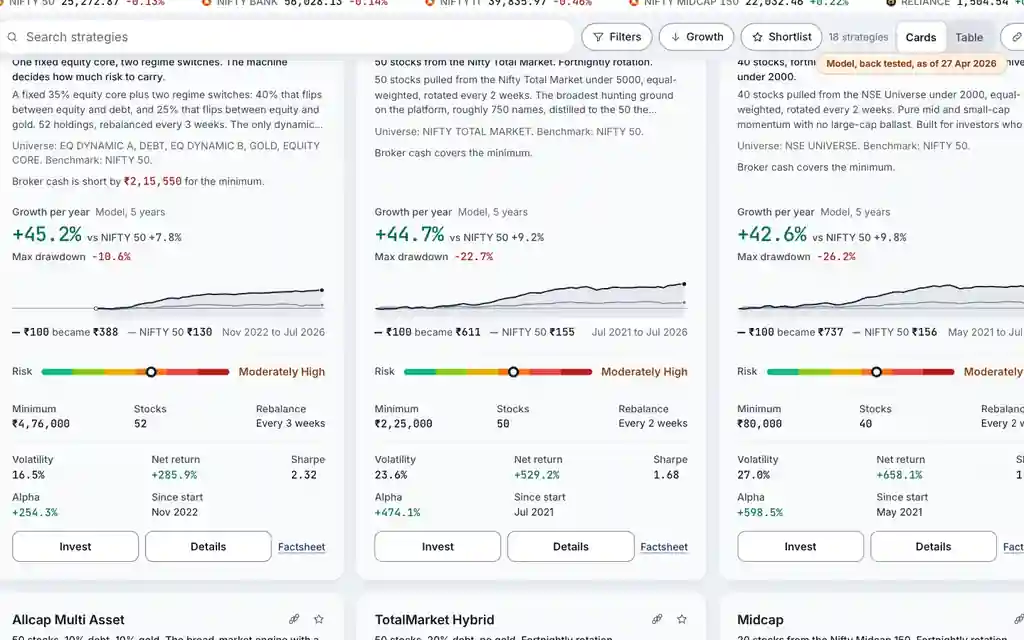
Where it is
ScreenMarketplace and StrategyBasic
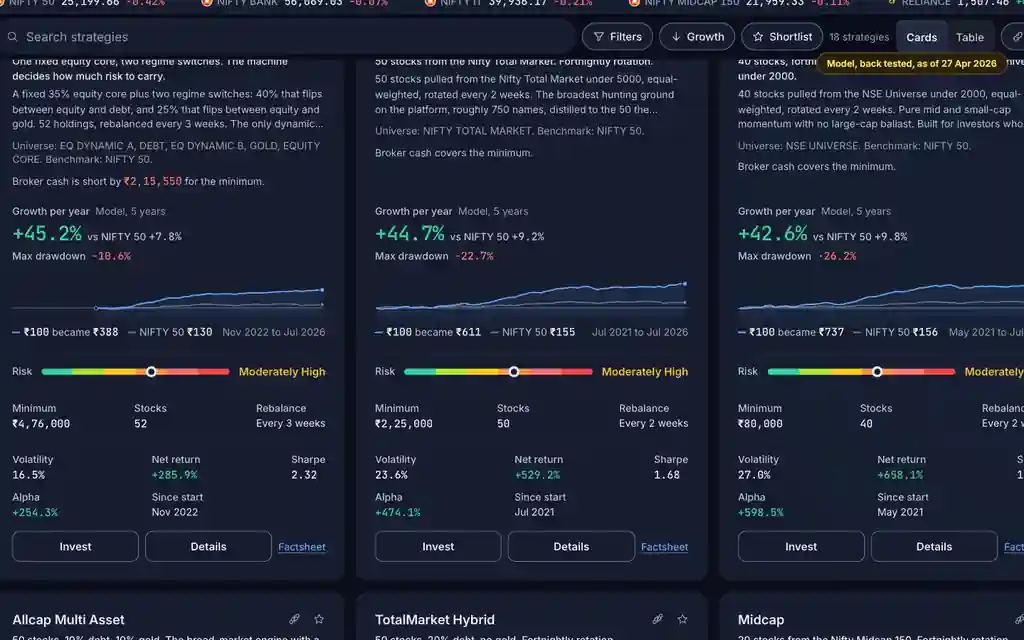
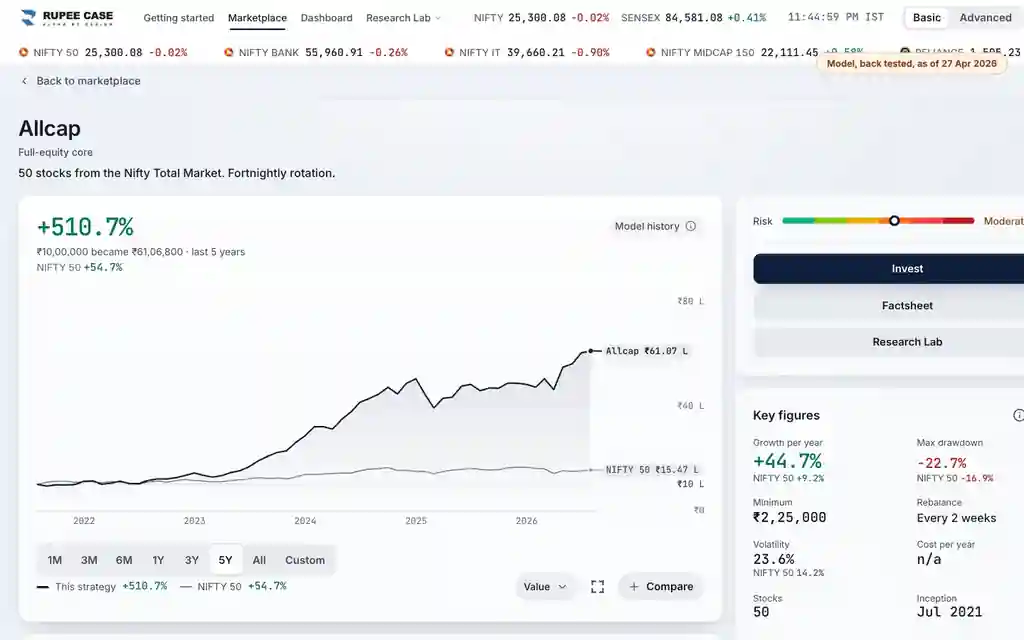
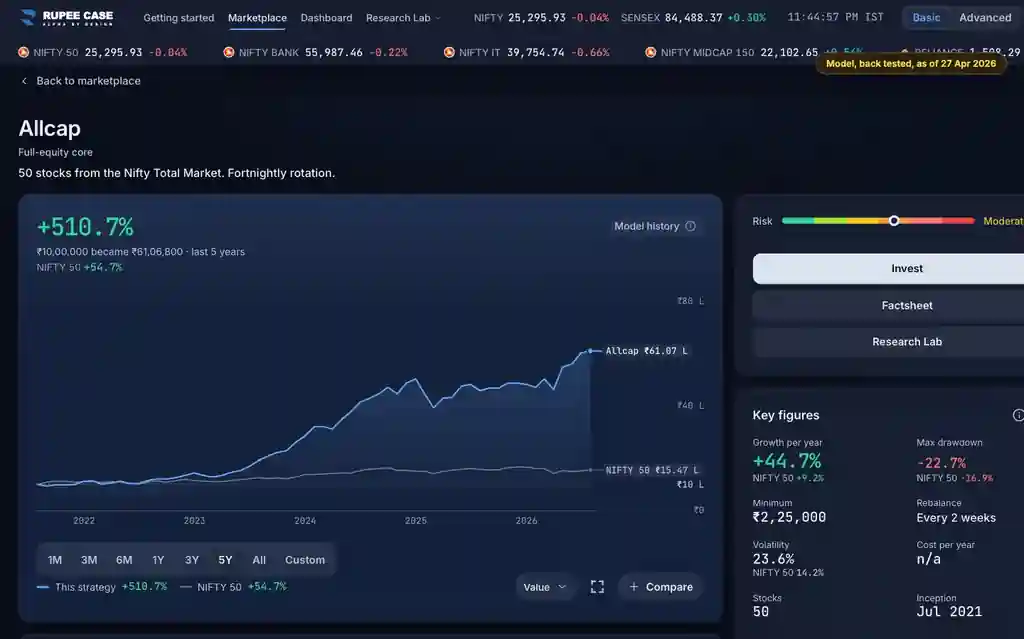
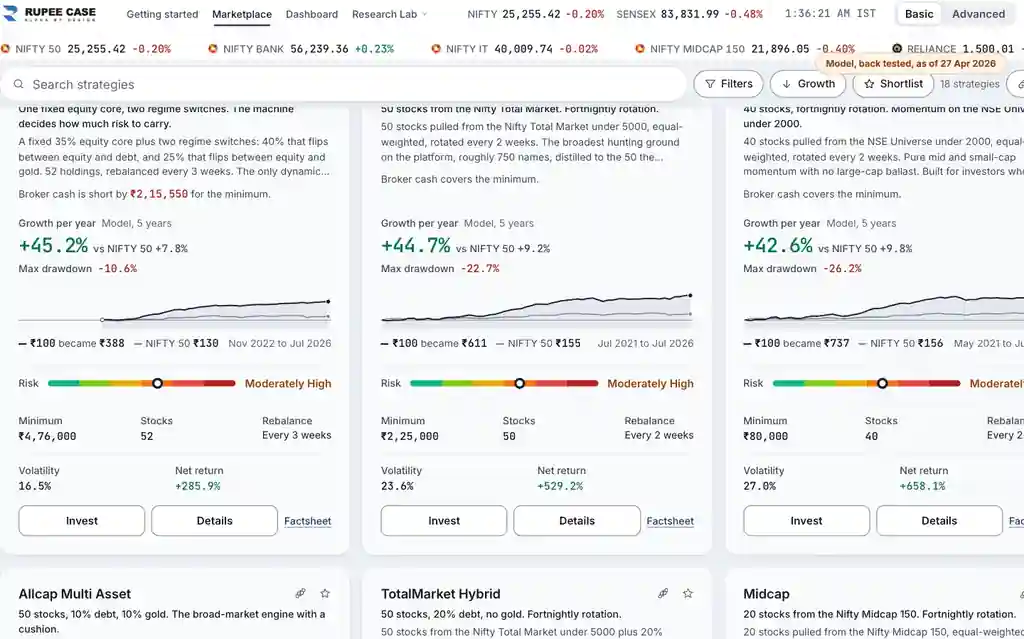
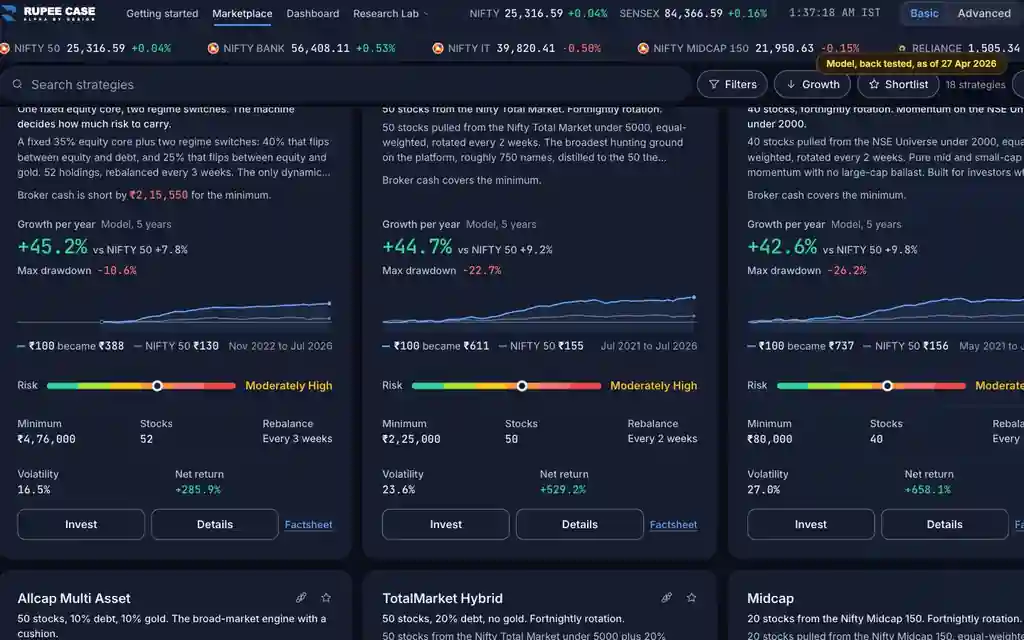
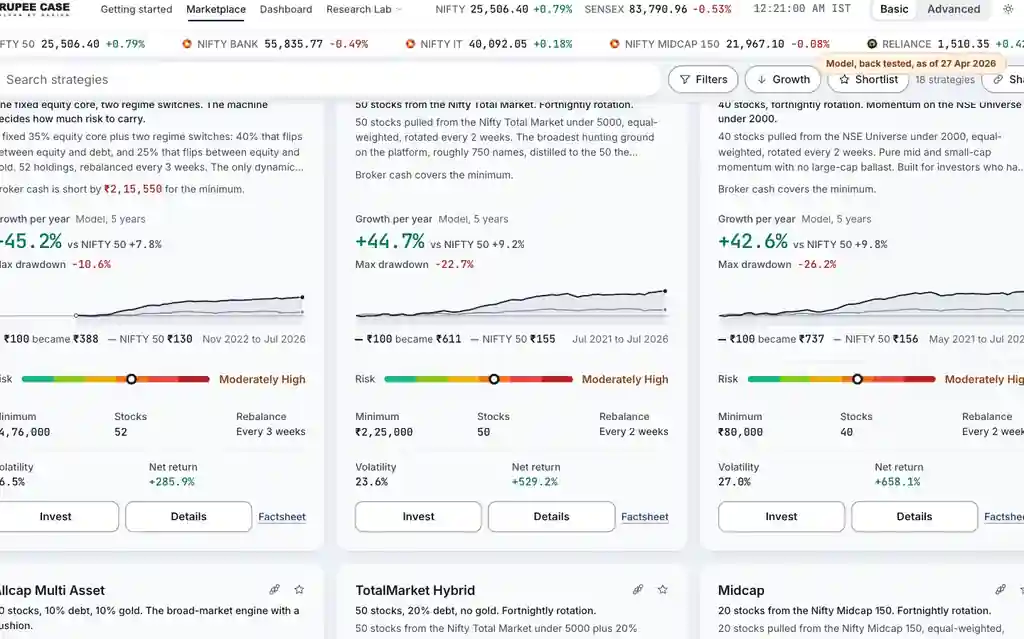
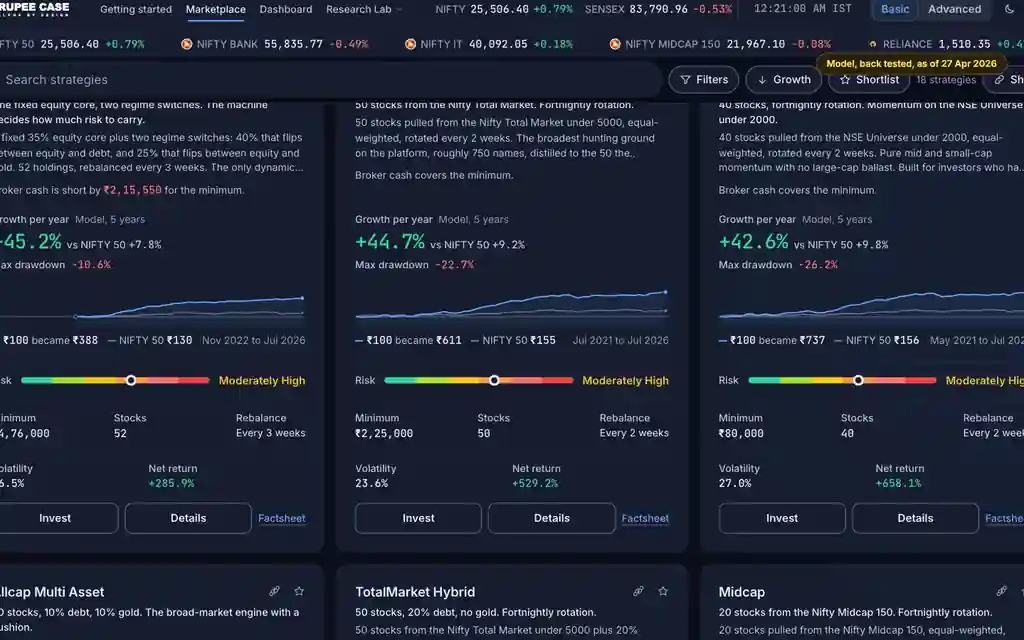
The "vs NIFTY 50" figure on each card, the benchmark line under the hero and the second line in the chart and legend. Basic and Advanced.
What it means
Each strategy is drawn against a benchmark index, NIFTY 50 by default. On the strategy page the benchmark starts at the same value on the same day as the model, so the gap between the lines is the difference in growth. The benchmark is an index level with no costs.
The formula
Both lines start at the same value on the window's first week. The vs figure is the benchmark's own return or growth per year over the same span.
Benchmark line = index level / index level at the window start x 100 (index level, no costs)
Card vs figure = benchmark growth per year over the full history
Hero vs figure = benchmark return over the chosen window
Worked example
Example only
- Window start: model 100, NIFTY 50 100
- Window end: model 150, NIFTY 50 125
- Model +50%, NIFTY 50 +25%: a gap of 25 points
How to read it
- The space between the lines is how far ahead or behind the model is.
- Read growth per year beside the benchmark's figure for the same span.
- The legend shows each line's return at the window end or the hovered week.
Watch out
- NIFTY 50 here is the price index: dividends are not added.
- The model is after estimated charges; the index has no costs.
- Changing the chart benchmark changes it on every strategy page.
Transcript
The video has no sound. These are its on screen captions, chapter by chapter.
- 0:00Where it is. Each card names its benchmark: here NIFTY 50.
- 0:17What it means. Both lines start together on the window's first week.
- 0:36Worked example. Worked example, example only: Window start: model 100, NIFTY 50 100. Window end: model 150, NIFTY 50 125. Model +50%, NIFTY 50 +25%: a gap of 25 points.
- 0:41How to read it. How to read it: The space between the lines is how far ahead or behind the model is. Read growth per year beside the benchmark's figure for the same span. The legend shows each line's return at the window end or the hovered week.
- 0:47Watch out. Watch out: NIFTY 50 here is the price index: dividends are not added. The model is after estimated charges; the index has no costs. Changing the chart benchmark changes it on every strategy page.
Terms in this tutorial
- Nifty 50Index of 50 large-cap Indian stocks representing about 65 percent of NSE free-float market cap.
- Nifty 500Broader index of 500 Indian stocks covering roughly 95 percent of free-float market cap.
- index fundMutual fund that replicates an index.