

Company numbers..10 min read
Profitable and broke
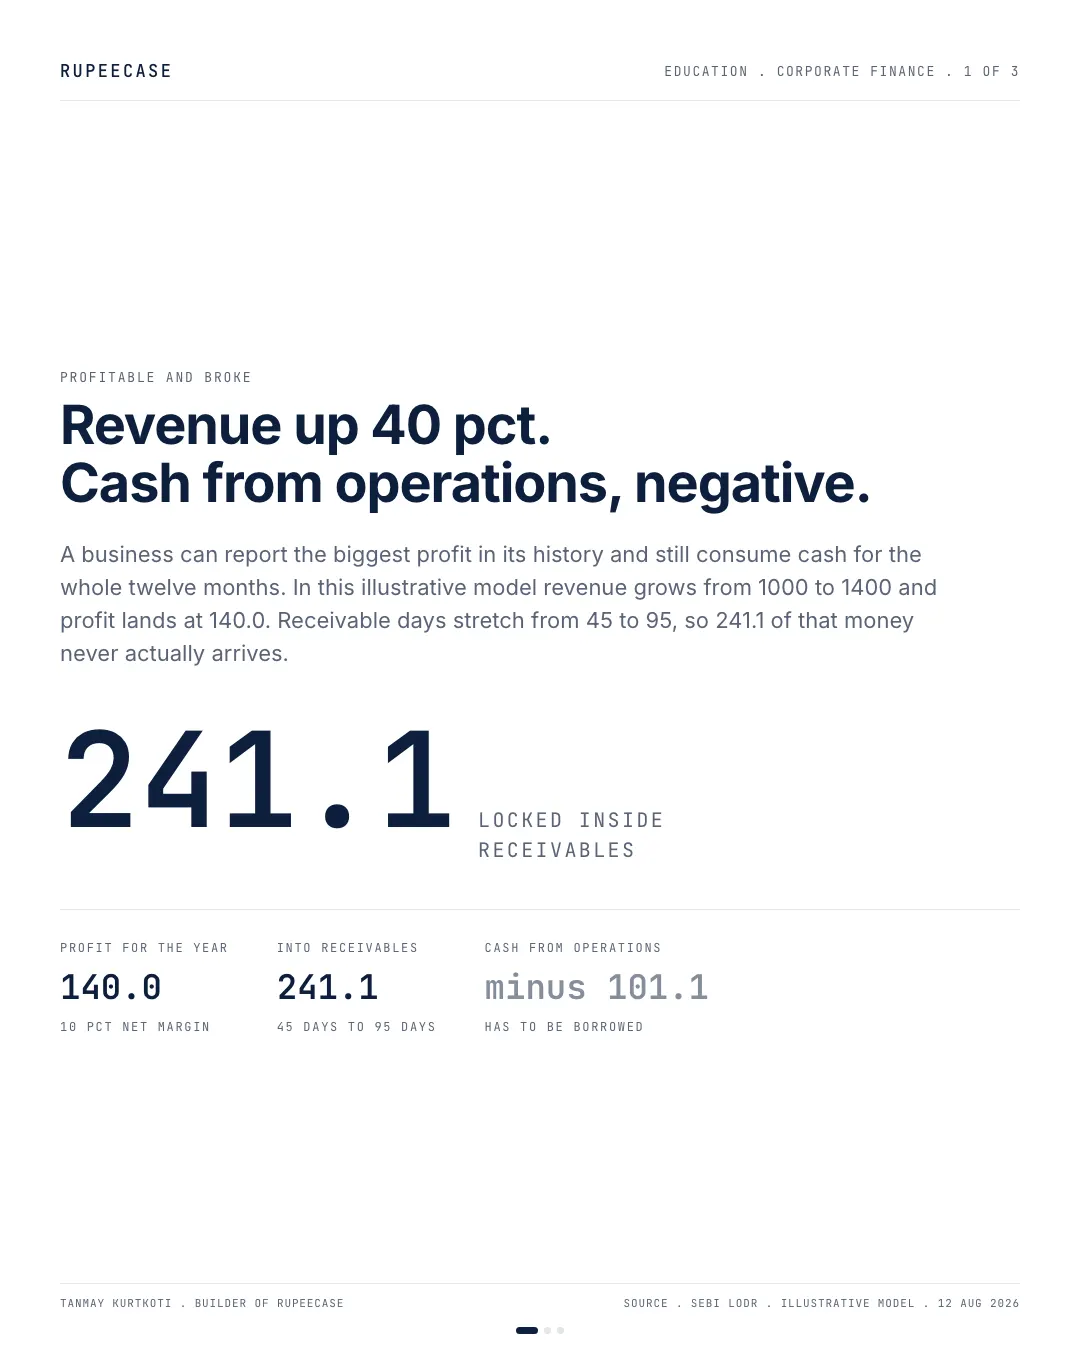
Stretching receivable days from 45 to 95 on 40 percent growth turns a 140 profit into minus 101 of operating cash, and the banker read the third statement first.
By Tanmay Kurtkoti, founder of QC Alpha and builder of RupeeCase
Tuesday evening, a founder I have known for eight years forwards me his annual results and one line of text. "Biggest year we have ever run. So why has my banker gone cold on me?"
I opened the PDF in the car. Revenue up 40 percent. Profit after tax up. The stock had moved in the fortnight since the numbers landed, and two brokerages had raised their price targets. Every headline number was doing exactly what a good year is supposed to do.
Then I scrolled past the profit and loss statement, past the balance sheet, to the third statement. The one almost nobody opens. For the full twelve months, the business had consumed cash.
His banker was not being difficult. His banker had read a different page.
Profit is an opinion about timing. Cash is a fact about a bank account. The one line that reconciles them is working capital.
Three companies, the same profit, three different businesses
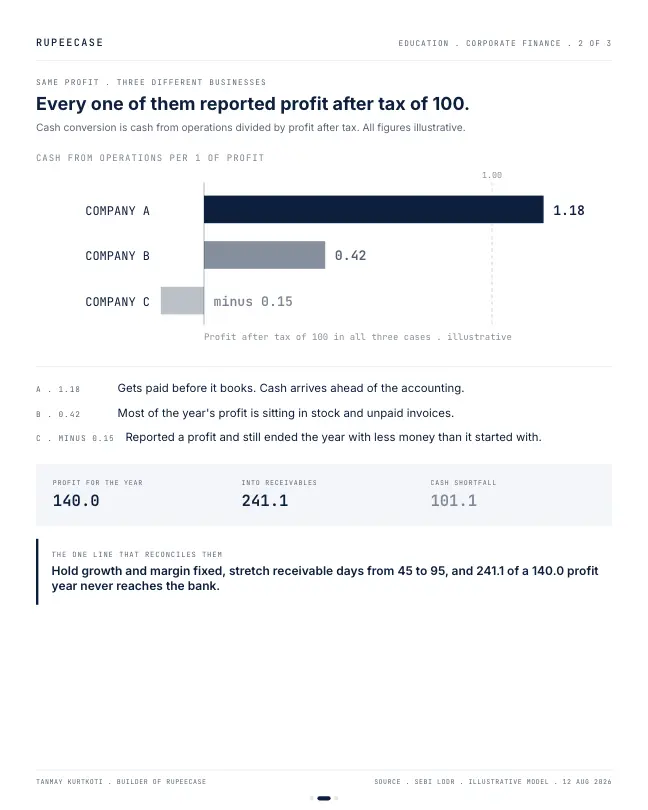
Start with the cleanest version of the problem. Three companies, all figures illustrative and all in the same unit, each reporting profit after tax of 100 for the year. On a screener sorted by earnings they are indistinguishable. Put each one's cash from operations next to that profit and they stop being indistinguishable.
| Company | Profit after tax | Cash from operations | CFO to PAT | What that actually says |
|---|---|---|---|---|
| A | 100 | 118 | 1.18 | Gets paid before it books. Cash arrives ahead of the accounting. |
| B | 100 | 42 | 0.42 | Most of the year's profit is sitting in stock and unpaid invoices. |
| C | 100 | minus 15 | minus 0.15 | Reported a profit and still ended the year with less money than it started with. |
Same profit line. One business threw off 18 more cash than it reported, one converted under half, and one went backwards while its annual report said it made money. The ratio in the fourth column is cash conversion, and it is the most useful single number on the whole set of results. It is also the one that never makes it into the forwarded message.
The word illustrative is doing real work in that paragraph. I have not named a company and I am not going to. The shape is the point, not the ticker.
The only thing I changed was how long customers take to pay
Here is the model, and it fits in one sentence: hold the growth rate and the margin fixed, stretch only the number of days customers take to pay, and watch the bank account.
Revenue goes from 1000 to 1400. Up 40 percent, a genuinely strong year, and nothing about it is fake. The margin holds at 10 percent, so the year's profit is 140.0. The one thing that moves is receivable days, from 45 to 95. Customers who used to settle in about six weeks now take a little over three months.
Receivables at the start are 1000 times 45 over 365, which is 123.3. At the end they are 1400 times 95 over 365, which is 364.4. The difference, 241.1, is money the company has earned, booked, been taxed on and reported, and has not received.
The diagram makes the mechanism visible in a way the ratio cannot. The leak is not a cost and it is not a loss, so it never touches the profit and loss statement at any point. It is the company's own money, parked in other people's bank accounts, earning the company nothing.
The gap is larger than the entire year's profit
Set the two numbers next to each other and the arithmetic stops being abstract. The year's profit is 140.0. The cash that walked into receivables is 241.1. The profit does not cover it.
There is a second way to hold that same number, and it is the one I find harder to shake. The company added 400 of extra revenue this year. Of that, 241.1 never turned into money, which is about 60 percent of everything it worked to win. Six rupees in every ten of the growth exist only as a promise from somebody else, sitting on the asset side of a balance sheet, tagged as an asset because that is what the accounting standard says it is.
On this deliberately stripped model, where receivables are the only thing allowed to move, cash from operations lands at minus 101.1 against a reported profit of 140.0. A cash conversion of minus 0.72. The company had its strongest year on the books and has to borrow to pay for it. Nothing was stolen, nothing was faked, no accountant did anything wrong. Growth simply arrived with an invoice attached.
The number that stopped me was the one I nearly did not compute
I ran the same model a second time with one change. Revenue still grows 40 percent. Margin still 10 percent. Receivable days hold at 45 instead of stretching to 95.
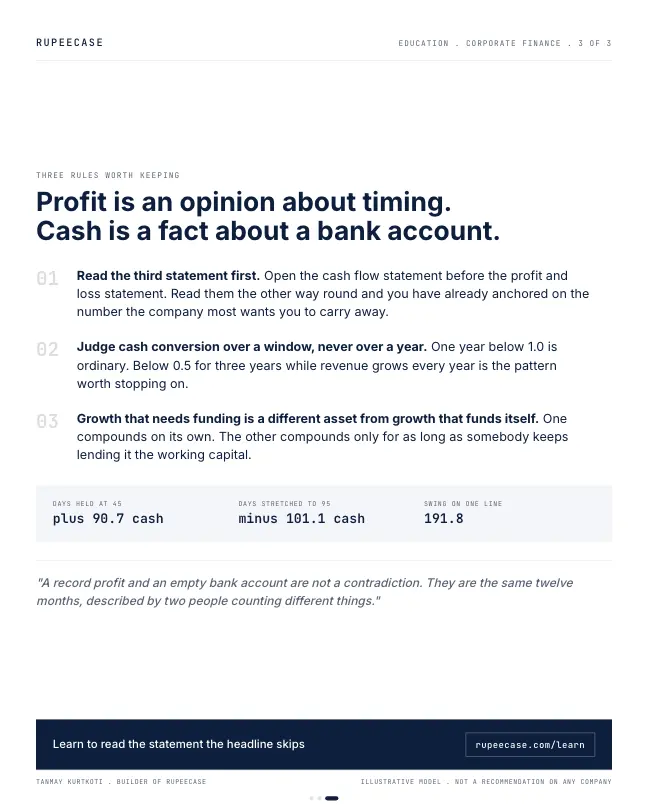
Receivables end the year at 1400 times 45 over 365, or 172.6. The increase is 49.3. Against a profit of 140.0 that leaves 90.7 of cash actually in hand, all figures illustrative.
Same growth. Same margin. Same reported profit of 140.0. One version finishes the year with 90.7 spare and the other has to raise 101.1. A swing of 191.8, driven entirely by a line that appears nowhere in the profit and loss statement and gets no sentence in the press release.
That was the one that changed how I read a set of results. I had always filed receivable days under housekeeping. On these numbers it moves the year's cash more than the margin does.
Why the banker and the shareholder read the same page differently
A lender's claim is fixed in rupees and dated. It gets settled out of cash, on a schedule, and no quantity of reported profit will settle it. So a lender opens the cash flow statement first and treats the profit line as context.
An equity holder's claim is residual and open ended. There is no date on it. The value sits in the trajectory of earnings over years, which means an equity investor can look straight at the profit line and the growth rate and stop there without being irrational.
Both are behaving sensibly. They are reading the same document, weighting different pages, and they will disagree about the same company for a year or more before one of them is proved right. When the lender turns out to be right, the equity holder usually finds out through a rights issue, a dilutive placement, or a covenant breach. All three arrive with no warning if earnings were the only thing you were watching.
What happens when the whole sector funds growth this way
The second order effect is where this gets uncomfortable. Stretching credit terms works. It wins orders. So a competitor matches it, then another, and inside a few quarters the entire sector's receivable days have drifted out together. Nobody's competitive position has changed. Every balance sheet is longer and more dependent on rolling over short term borrowing.
That looks fine right up until short term money gets more expensive, or one large customer delays a payment run. Then several companies discover the same problem in the same quarter, because they were all financing the same customers. Growth funded by extending credit is correlated risk wearing the costume of individual company performance. This is the kind of thing a systematic screen applied across a whole universe can catch and a story driven single stock pick usually cannot, because the story is about the company and the risk is about the sector.
Where this argument breaks
Weak cash conversion is not automatically a warning, and treating it as one costs money. A company building inventory ahead of a demand cycle it can genuinely see coming prints exactly the same ugly ratio, and is right to. So does a manufacturer scaling a new plant into an order book it already holds. Sell every business that has one poor conversion year and you will sell good compounders early, repeatedly, and feel clever each time.
The distinction is not the level of the ratio. It is which line is moving. Receivable days stable while volumes grow is a business investing in growth. Receivable days stretching while volumes grow is a business buying growth with its own balance sheet. Those two produce the same headline number and mean opposite things.
So here is the falsification, plainly. If receivable days come back to the old level the following year while revenue holds, the cash gap was a timing artefact and not a warning, and I was wrong to flag it.
Two more caveats worth stating. My model is stripped to one moving part. Real cash flow statements also carry depreciation, payables, inventory and tax timing, any of which can offset or deepen the receivable effect. And a single year of weak conversion tells you close to nothing. The test that works is lining up cash from operations against profit after tax across three or four consecutive years, not one. One year below 1.0 is ordinary. A run of years below 0.5 while revenue climbs every year is the signal, and it is worth learning to read before you act on it.
Three rules I use now
Read the third statement first. Open the cash flow statement before the profit and loss statement, every time, not because profit is dishonest but because profit is a judgment about when a sale counts and cash is a record of what arrived. Read them the other way round and you have already anchored on the number the company most wants you to carry away.
Judge cash conversion over a window, never over a year. Line the ratio up for three or four consecutive years and look at the shape of it. Below 1.0 in a heavy investment year is normal. Below 0.5 for three years while revenue grows every year is the pattern worth stopping on.
Treat growth that needs funding as a different asset from growth that funds itself. Both can be good businesses. They are not the same instrument and they should not be compared on one screen without that column. One compounds on its own. The other compounds only for as long as somebody keeps lending it the working capital.
My friend's company is fine, for now. The order book is real, the customers are large and slow rather than large and shaky, and the receivable stretch looks like a deliberate trade for market share. He knew what he was doing. He just did not expect the cash flow statement to tell his banker before he did.
A record profit and an empty bank account are not a contradiction. They are the same twelve months, described by two people counting different things.
Questions readers ask
What is the short answer?
Stretching receivable days from 45 to 95 on 40 percent growth turns a 140 profit into minus 101 of operating cash, and the banker read the third statement first.
Where can I learn company numbers properly?
In the free RupeeCase Learn library: Company numbers, learn it free, no sign up needed. Modules come with quizzes, calculators and a path test.
Is this note investment advice?
No. It is an educational note by Tanmay Kurtkoti. RupeeCase is a technology platform, not a fund, a PMS or a SEBI registered investment adviser.
The cards
3 cards. Swipe, or tap to open.
Explore next
Learn it properly, then see it applied.
Related
- EBITDA is not profitA 28 percent EBITDA margin became a 3 percent net margin after depreciation, interest and tax, and eight times EBITDA worked out to about 41 times earnings.Company numbers . . 6 min
- Other income: you are buying the factory, not the FDReported profit rose from 170 to 200 while core business profit fell from 120 to 110, because other income's share of pre tax profit climbed from 29 to 45 percent.Company numbers . . 5 min
- The business that grows on its suppliers' moneyA 135 day cash conversion cycle needs Rs 37 crore to fund Rs 100 crore of extra sales, while a minus 35 day cycle is handed about Rs 10 crore for the same growth.Company numbers . . 5 min
Educational content only. Figures are illustrative and computed on historical or representative data for teaching purposes, not investment advice. Past performance does not guarantee future returns. Sourced from NSE, BSE, SEBI, AMFI and RBI public data.