


Factors..11 min read
Momentum pays, then bites
Momentum's winner minus loser portfolio runs a 0.71 Sharpe since 1927 and lost about 91 percent in two months of 1932 while the market rose 82, because the crash is the short leg.
By Tanmay Kurtkoti, founder of QC Alpha and builder of RupeeCase
Tuesday evening a reader sends me a photo of a factsheet. An actual photo, of actual paper, three rows marked in yellow highlighter. Five year number. Ten year number. Since inception. A momentum fund, and every one of those rows sits ahead of the plain index by a distance that makes you put your tea down.
His message under the photo was two words long. "Why not?"
Fair question. I have been asked some version of it every year I have spent building systematic books. So I did what I always do, which is go back to the one piece of research nobody has managed to argue away, and then sit in a spreadsheet for an hour trying to make the answer smaller than it is.
I could not make it smaller.
The factsheet is not lying about the long run
Momentum has the strongest long run record of the classic factors, and it is not a close race. Kent Daniel and Tobias Moskowitz, writing in the Journal of Financial Economics in 2016, laid out the American numbers back to 1927. Their winner minus loser portfolio, a research construct holding the past twelve month winner decile and shorting the loser decile, runs a Sharpe ratio of 0.71 against 0.40 for the market. Its beta is minus 0.58, so on paper it leans the opposite way from your equity book. The unconditional alpha lands at 22.3 percent a year with a t statistic of 8.5.
Those are backtested figures on a research portfolio, not a product anyone could have bought. No fee, no tax, no borrow cost, no slippage on shorting a thousand broken small caps in 1932. Haircut all of it and the signal is still there. It turns up in factor research across geographies, decades and asset classes.
Value gets the better press. Momentum has the better arithmetic. So the question stands. Why not?
Then there are the two months in 1932
Here is what a factsheet never shows you. Across the entire 1927 to 2013 record, the two worst months that momentum portfolio ever had are consecutive. July 1932, minus 60.98 percent. August 1932, minus 74.36 percent. Ranked second and first out of more than a thousand months. The compounded figure usually quoted for that episode is a fall of roughly 91.59 percent.
2009 ran the same play on a gentler scale. March, minus 42.28 percent. April, minus 45.52 percent. August, minus 30.54 percent. Three of the ten worst momentum months in eighty six years landed inside one calendar year, and the March to May window came to a fall of roughly 73.42 percent.
Now the line that made me stop and run it again.
During those two months in 1932 when momentum lost more than nine tenths of its value, the market rose 82 percent.
Not a crash. A rally. The thing momentum was trading nearly doubled in two months and the strategy was almost wiped out doing it. In the 2009 window the market was up 26 percent while momentum was cut by three quarters. Every intuition you have about a blow up is built around the market falling. This one blows up on the way back.
Climbing out is a different arithmetic from falling in
Everyone knows a fall and its recovery are not symmetric. Almost nobody carries the actual numbers around, and the numbers are where this stops being a slogan.
A 60 percent fall needing 150 percent back is already brutal, and most people can hold that idea in their head. What breaks the head is that pushing the fall from 60 to 91.59, about thirty percentage points further, pushes the climb from 150.00 to 1089.06. The damage curve is not steep. It is vertical at the end.
Say it in rupees instead of percentages and it gets worse, because percentages let you pretend.
Eight rupees and forty one paise. That is what is standing after the 1932 episode, out of every hundred you put in. The climb from there is not a bad year you grind back. It is a decade of the same strategy working perfectly, spent entirely on getting to where you already were.
Twenty four years, two bad quarters, and ten points of compounding
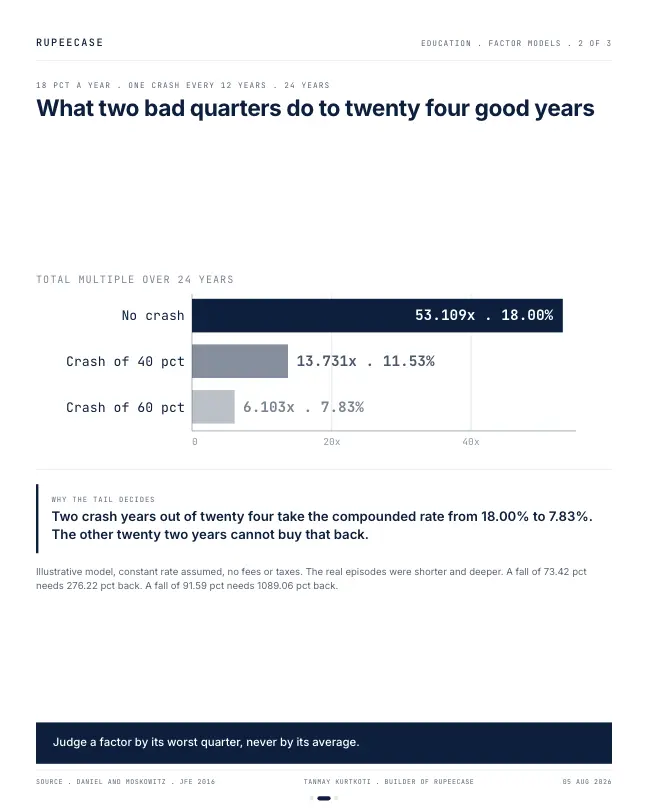
So I built the smallest model I could that shows what this costs. One sentence: a strategy compounds at 18 percent a year for twenty four years, and once every twelve years a crash replaces one of those years with a large loss. Two crash years out of twenty four. Everything else untouched.
| One crash every 12 years | Total multiple, 24 years | CAGR | Points of CAGR given up |
|---|---|---|---|
| No crash at all | 53.109x | 18.00% | . |
| A fall of 40 pct | 13.731x | 11.53% | 6.47 |
| A fall of 60 pct | 6.103x | 7.83% | 10.17 |
Illustrative model, constant rate assumed, no fees or taxes in it. Look at the bottom row. Two bad years out of twenty four and the compounded rate falls from 18.00 percent to 7.83 percent. More than ten percentage points of annual return, surrendered by twenty two good years to two bad ones. The multiple goes from 53 times your money to 6 times.
And the real episodes were not even years. 1932 was two months. 2009 was three. Call it two bad quarters out of ninety six, and roughly two percent of the calendar decides more than half of what the other ninety eight percent built. Which is why twenty two green years on a factsheet tell you almost nothing about what you will earn.
It breaks at the bottom because that is where the book is pointed
This is the part I want the reader with the highlighter to sit with. The crash is not a flaw better execution fixes. It is the mechanism doing what it was built to do.
Follow the chain and it becomes obvious in a way it was not five minutes ago. A long decline beats up the fragile, indebted, high beta companies worse than anything else. Those are the names that end up in the loser decile, which means a momentum book is by construction short the most beaten down, highest beta corner of the market at exactly the moment it is cheapest. Daniel and Moskowitz measured the beta of that short leg in those periods and found it running as high as four or five.
Then the turn comes. In July and August 1932 the loser decile rose 232 percent while the winner decile managed 32 percent. From March to May 2009 the losers rose 163 percent against 8 percent for the winners. At the start of that March the average loser decile firm was down 84 percent from its own peak, American banks and carmakers priced for extinction. Extinction did not arrive. They went up in a straight line and the momentum book was short every one of them.
The crash is not a bug in momentum. It is the machine working as designed, with the safety off.
Cutting size when the strategy gets loud is the standard fix
The honest response is not to avoid the factor. It is to stop running it at constant size. The standard treatment, the one Daniel and Moskowitz build in their own paper, is to scale exposure by the strategy's own recent volatility. When momentum's realised volatility spikes, you cut the book. That is it. No market forecast required. In their tests the dynamic version roughly doubles both the alpha and the Sharpe ratio of the static one.
What I like is what it refuses to do rather than what it does. Momentum volatility explodes at market bottoms, so the rule mechanically shrinks your short leg exactly when that leg is a coiled spring. Not clever. Just a decision made in advance, before your judgment gets a vote. That is the whole case for a rules based framework in one line.
Now the uncomfortable second order. Every serious quant desk knows this fix. The trigger is public, the data is public, the paper has been cited thousands of times. So when momentum volatility spikes, a great many books cut at the same moment for the same reason, and the covering of all those short legs is part of what makes the loser decile rip so hard in the first place. The fix does not remove the crash. It moves you from being the fuel to being one of the crowd scrambling for the door, which is better, but it is not safety. It also caps your right tail, because the rule that shrinks you into a bounce shrinks you into some perfectly good trends.
What would change my mind, and who should not own this
Three things I am not certain about, stated plainly.
The 91.59 percent figure for 1932 is the one commonly quoted. The published table gives the two component months as minus 60.98 and minus 74.36, which compound closer to 90 percent flat. A data vintage difference I have not chased down. Nothing here turns on that point and a half, but you should know I am quoting a number I could not reconcile to the decimal.
This is American equity data, largely pre 2013, on a long short research portfolio with no costs in it. Indian long only momentum indices cannot short, which removes the exact leg that does the damage. A long only sleeve here is a milder animal.
Here is what would change my mind. If a momentum book that was flat or long beta at the bottom had still crashed in 1932 and 2009, the short leg is not the mechanism and my explanation is wrong. The winner decile would have had to take a comparable hit. It went up 32 percent in 1932 instead. The loss came from the short side.
And the counter case, named. Momentum is wrong for anyone who cannot sit through twelve to twenty four months of trailing a plain index. Not because trailing is fatal, but because of when you quit. The underperformance and the rebound are the same event seen from two ends, so you will be at your most exhausted, with the most evidence, at the point the factor is about to pay. Anyone who needs the money in three years, or who opens a strategy comparison every fortnight, should stay away from a concentrated momentum book. The exit is the risk, not the factor.
Three rules I keep coming back to
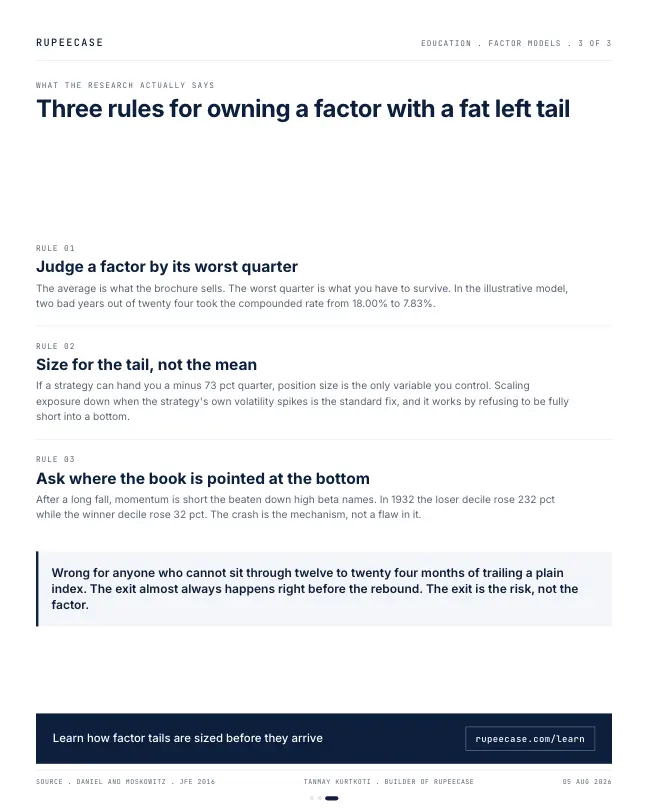
Judge a factor by its worst quarter, never by its average. The average is what the brochure sells. The worst quarter is what you have to survive. Two bad quarters out of ninety six took my model from 18.00 percent to 7.83 percent. Any assessment that starts at the ten year number and stops there has skipped the only part that matters.
Size for the tail, not the mean. If a strategy can hand you a minus 73 percent quarter, size is the only variable you actually control, and it should be set by the depth of the hole rather than the height of the average. A book that gets cut when its own volatility spikes is the difference between a bad year and a decade climbing back to par.
Ask where the strategy is pointed at the bottom, not at the top. Everything looks fine mid trend. The question worth asking of any systematic book is what it holds, and what it is short, on the day everyone else panics. If it is short the thing that will rip hardest, you have found the crash before it finds you.
Momentum carries the strongest long run average and the ugliest tail in the same body, and those two facts are not independent. It earns the average by leaning hard into the trend, and it pays for that by being maximally wrong on the one day a decade when the trend snaps.
The reader with the highlighter was asking the wrong question. Not why not. When.
Questions readers ask
What is the short answer?
Momentum's winner minus loser portfolio runs a 0.71 Sharpe since 1927 and lost about 91 percent in two months of 1932 while the market rose 82, because the crash is the short leg.
Where can I learn factors properly?
In the free RupeeCase Learn library: Factors, learn it free, no sign up needed. Modules come with quizzes, calculators and a path test.
Is this note investment advice?
No. It is an educational note by Tanmay Kurtkoti. RupeeCase is a technology platform, not a fund, a PMS or a SEBI registered investment adviser.
The cards
3 cards. Swipe, or tap to open.
Explore next
Learn it properly, then see it applied.
Related
- Momentum factor primerMomentum means ranking on twelve months with the latest month skipped, a premium of about four points a year in India, paid out lumpy and interrupted by three crashes.Factors . . 6 min
- The edge decays when you read about itMcLean and Pontiff measured 26 percent decay out of sample and 58 percent after publication, which stretches a 0.60 Sharpe's proof time from 11 years to 59.Factors . . 11 min
- Dividend yield: the denominator does the workA 5 percent yield from a crashed price and one from a doubled payout look identical on a screener, and since April 2020 dividends are taxed at slab, 31.2 percent at the top.Factors . . 8 min
Educational content only. Figures are illustrative and computed on historical or representative data for teaching purposes, not investment advice. Past performance does not guarantee future returns. Sourced from NSE, BSE, SEBI, AMFI and RBI public data.