

Factors..11 min read
The edge decays when you read about it
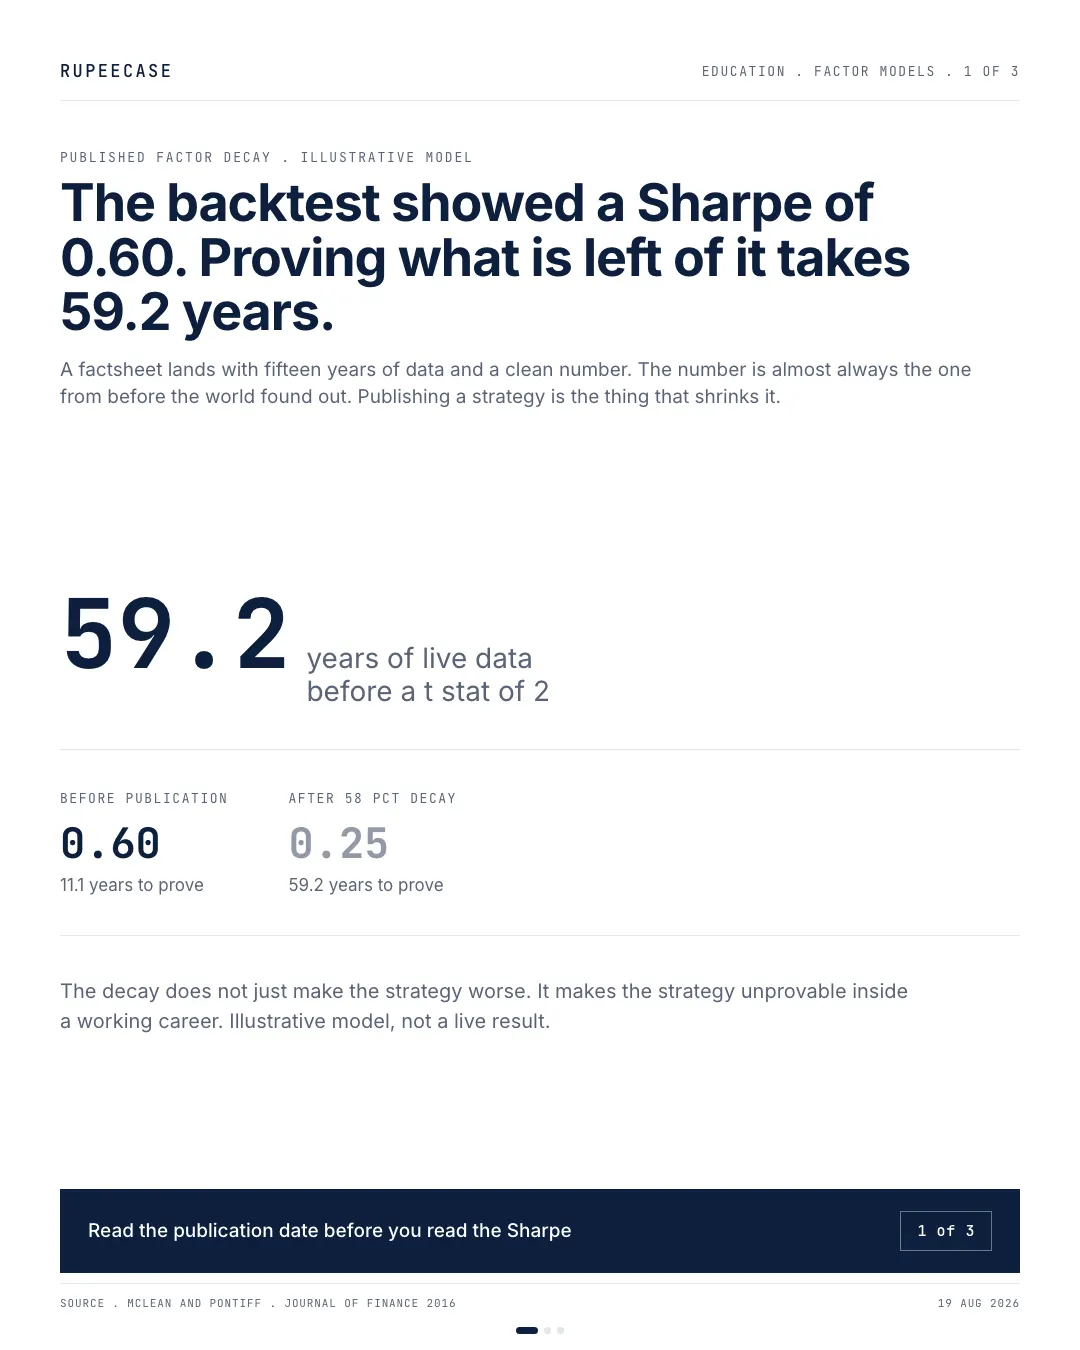
McLean and Pontiff measured 26 percent decay out of sample and 58 percent after publication, which stretches a 0.60 Sharpe's proof time from 11 years to 59.
By Tanmay Kurtkoti, founder of QC Alpha and builder of RupeeCase
Tuesday morning a PDF lands in my inbox with the subject line "clean numbers, have a look". Fifteen years of daily data. A Sharpe ratio of 0.60. A line on a chart that climbs with the sort of patience you only ever see inside a spreadsheet.
The sender is not a mug. He runs real money, he had read the paper the rule came out of, he could name both authors, and he had already checked that the signal was simple enough not to be a curve fit. His question was a fair one. Fifteen years and a 0.60. Is that enough to write a cheque against?
I asked him one thing back. What year was it published?
Almost every number on a factsheet is a number from before the world found out.
The paper that went back and measured its own damage
One study keeps turning up in this argument and it has earned the traffic. R. David McLean and Jeffrey Pontiff, "Does Academic Research Destroy Stock Return Predictability?", Journal of Finance, 2016. They took 97 variables that peer-reviewed research had shown to predict stock returns in the cross section, and then did the obvious thing nobody had bothered to do at scale. They asked what those same signals did next.
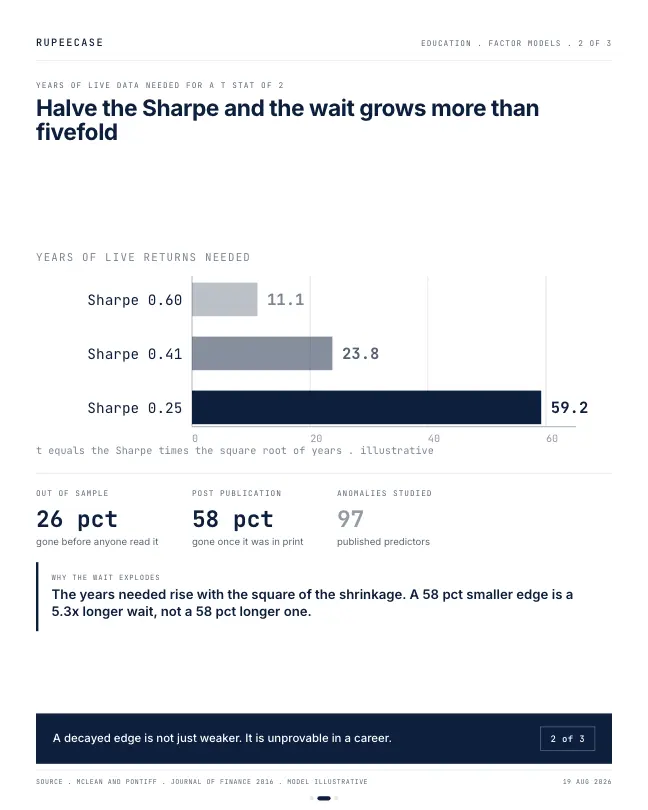
Two numbers came out. Portfolio returns were 26 percent lower out of sample, meaning in the stretch after each study's own data ended but before anyone had read about it. And they were 58 percent lower after publication.
The gap between the two is where the story lives. Twenty six points of shrinkage showed up before a single reader knew the strategy existed. The other thirty two points arrived once it was in print. The authors attribute that second slice to publication-informed trading, which is the polite phrasing for people reading the paper and turning up with money.
The bars are doing something the headline number hides. Most people hear "58 percent decay" and picture one event. It is two, and they have nothing to do with each other. The first instalment is the backtest quietly admitting it was flattered. The second is your own competition arriving.
Then I did the arithmetic that ruins the pitch
Take the factsheet at face value. A 0.60 before anyone read about it. Apply only the publication slice, 32 percent, and you land at 0.41. Apply the full 58 and you land at 0.25. Those are illustrative figures, a percentage haircut from a published study laid onto one hypothetical Sharpe, not anyone's live result.
Fine. A weaker strategy is still a strategy. That was my first reaction too, and it took me an embarrassingly long time to notice it is the wrong question.
The right question is how long you would have to run the thing before you could tell whether it was working at all.
There is a small piece of arithmetic for that and it is the spine of this entire piece. The t-statistic sitting on a track record is roughly the Sharpe ratio multiplied by the square root of the number of years you have been running it. Set the bar at a t of 2, the loose convention for "probably not luck", and the years you need is two divided by the Sharpe, then squared.
Read the bars before you read the numbers. The Sharpe fell by a little over half. The wait did not rise by half. It rose more than fivefold, because a squared relationship is brutally unkind once the base number gets small. That third bar is not a longer version of the first bar. It is a different category of thing.
Fifty nine years is not a wait, it is a refusal
Laid out as a ledger the point gets harder to argue with.
| Stage of life | Sharpe | Years to a t stat of 2 | Wait vs the brochure |
|---|---|---|---|
| What the backtest showed | 0.60 | 11.1 | . |
| After the 32 pct publication slice | 0.41 | 23.8 | 2.1x |
| After the full 58 pct decay | 0.25 | 59.2 | 5.3x |
Row two is the one that should sting. A 32 percent haircut, the portion that exists purely because the paper got read, more than doubles the time you owe the strategy before you are allowed an opinion about it. Row three is not really a number at all. It is a life sentence.
Say it without the softening. The decay does not simply make the strategy worse. It makes the strategy unprovable inside a working career. Someone who starts at twenty five, runs the decayed version with perfect discipline, never flinches through a drawdown, never touches the rule, and is still at the desk at eighty four, has only just cleared the bar. In practice nobody does that. They quit at year four after a bad patch, and the honest thing to admit is that year four told them nothing either way.
The 26 and the 32 are two different diseases
Splitting the decay matters because the two halves need different responses, and the brochure treats them as one blur.
The 26 percent that vanished out of sample was never really there. It is the backtest confessing. Some of it is genuine over-fitting, some of it is the ordinary optimism of a researcher who tried a few specifications and reported the one that worked. There is no capacity discipline that fixes this, because nothing broke. The number was flattered from birth.
The 32 percent that vanished after publication is a crowding effect and it behaves completely differently. It scales with how much money reads the paper. A signal that trades illiquid small caps can be arbitraged away by a fraction of the capital that a large cap signal would need. So the same 32 percent average hides an enormous spread. Some anomalies got wiped out. Some barely moved.
Which half you are looking at changes what you should do. Over-fitting means walk away. Crowding means ask about capacity, ask who else is in, and ask what happens when they leave. Only one of those is a conversation worth having with the person selling you the fund.
What everyone does once proof stops being available
Here is the second-order bit, and it is worse than the arithmetic.
If a live track record can never settle the question inside a career, then live track records stop being the evidence anybody uses. The backtest becomes the evidence of record by default, because it is the only thing that can produce a number in time for a fundraise. That is not laziness on the buyer's part. It is what happens when the honest alternative takes six decades.
Now run that forward. Capital allocates on paper evidence, which means it allocates faster, which means it arrives sooner after publication, which compresses the spread sooner. The impossibility of proof does not slow the decay down. It accelerates it. The industry ends up in a loop where the only usable evidence is exactly the kind of evidence that the act of using it destroys.
And once you accept that data cannot settle it, only one thing is left standing. The reason the premium should exist in the first place.
The ones that survive publication had a reason to exist beforehand
Decay is not extinction, and I would be overselling this if I let you walk away thinking otherwise.
A factor with a genuine structural cause survives publication in weakened form. If the premium is compensation for holding something genuinely uncomfortable, a risk you are being paid to carry, then publishing it does not remove the discomfort. People still have to sit through the drought, and most still will not. If it is a behavioural pattern that does not stop, the pattern does not stop just because it was written up. The survivors are precisely the ones worth owning, and they are worth owning at their post-decay number, not their brochure number.
The chain shows what actually moves and what does not. Nothing about the rule changes between the first box and the last. What changes is how many people are standing on the other side of your trade, and that is the entire mechanism. So the question to put to any factor is not whether it worked. It is what discomfort you are being paid to hold, stated in one sentence, without the word backtest in it. If the answer is that a computer found it, expect the last box.
Where this argument could be wrong
Three things I would want a sceptic to throw at me.
The percentages are return haircuts and I have applied them to a Sharpe ratio, which is a return divided by a volatility. If the decay hits return and volatility together, a 58 percent cut to return is not a 58 percent cut to Sharpe, and the ladder is too harsh. The direction survives, the magnitude is a modelled illustration and nothing more.
A t of 2 is a convention, not a law of nature. Plenty of serious people argue the bar for factor research should be higher, given how many hypotheses have been tested against the same data. If anything that pushes the years the wrong way.
And the falsification. If a factor's live out-of-sample record over the decade after its publication matched its backtest closely, then the decay story simply does not apply to that factor, and I should say so out loud rather than reaching for an average that was computed across 97 other things. Averages are not verdicts on individuals.
Three rules I actually use
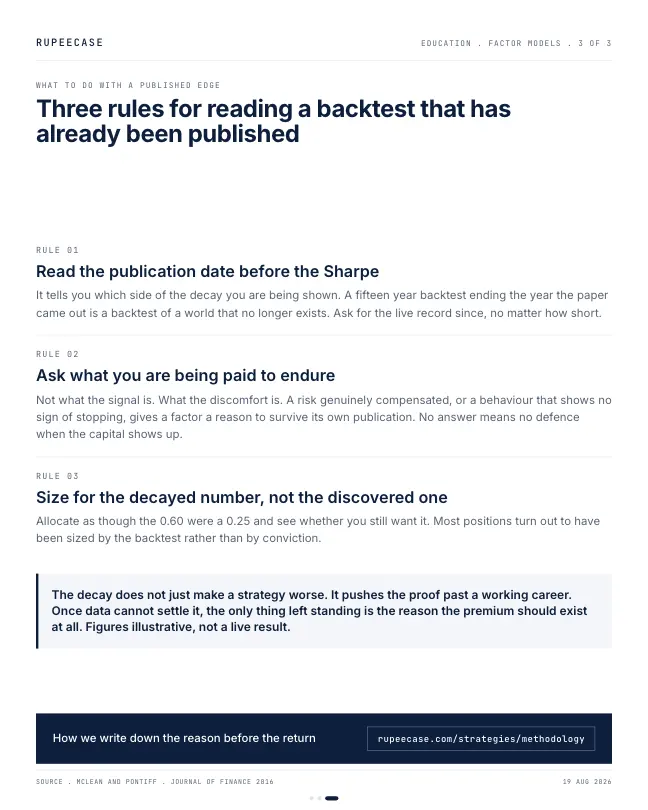
Read the publication date before the Sharpe. It tells you which side of the decay you are being shown. A fifteen year backtest that ends the year the paper came out is a fifteen year backtest of a world that no longer exists. Ask for the live record since, no matter how short and unflattering it is.
Ask what you are being paid to endure. Not what the signal is, what the discomfort is. If the honest answer is a risk you are genuinely compensated for holding, or a behaviour that shows no sign of stopping, the factor has a reason to survive its own publication. If there is no answer, the number has no defence when the capital shows up. This is the entire content of a serious methodology page and the reason we publish ours.
Size the position for the decayed number, not the discovered one. Whatever you were going to allocate on the strength of a 0.60, allocate as though it were a 0.25 and see whether you still want it. Most people find that the position they were about to take was sized by the backtest, not by conviction. A rules-based framework makes that a calculation instead of a mood.
The strategy in the PDF might be fine. It might be one of the survivors, weaker than advertised and still worth owning. But the fifteen years on the cover are not evidence for the version you would actually be buying, and the version you would actually be buying cannot be proven in the time you have.
That is not a reason to give up on factors. It is a reason to stop asking the data to do a job it was never able to do, and to start asking for the sentence underneath it.
Questions readers ask
What is the short answer?
McLean and Pontiff measured 26 percent decay out of sample and 58 percent after publication, which stretches a 0.60 Sharpe's proof time from 11 years to 59.
Where can I learn factors properly?
In the free RupeeCase Learn library: Factors, learn it free, no sign up needed. Modules come with quizzes, calculators and a path test.
Is this note investment advice?
No. It is an educational note by Tanmay Kurtkoti. RupeeCase is a technology platform, not a fund, a PMS or a SEBI registered investment adviser.
The cards
3 cards. Swipe, or tap to open.
Explore next
Learn it properly, then see it applied.
Related
- The turnover tax on a factorA 5.7 percent gross premium became 4.2 after trading costs, and factors traded slower than about half the book a month tend to keep a net edge.Factors . . 6 min
- The factor zooHou, Xue and Zhang rebuilt 452 published factors and found 65 percent failed a basic test and 82 percent failed an honest one.Factors . . 5 min
- Factor crowding and decayMcLean and Pontiff found the median published anomaly kept 42 percent of its in sample alpha, which is why a brochure backtest and a live fund can sit nine points apart.Factors . . 5 min
Educational content only. Figures are illustrative and computed on historical or representative data for teaching purposes, not investment advice. Past performance does not guarantee future returns. Sourced from NSE, BSE, SEBI, AMFI and RBI public data.