

Behaviour..12 min read
Your portfolio is not down. You are looking too often.
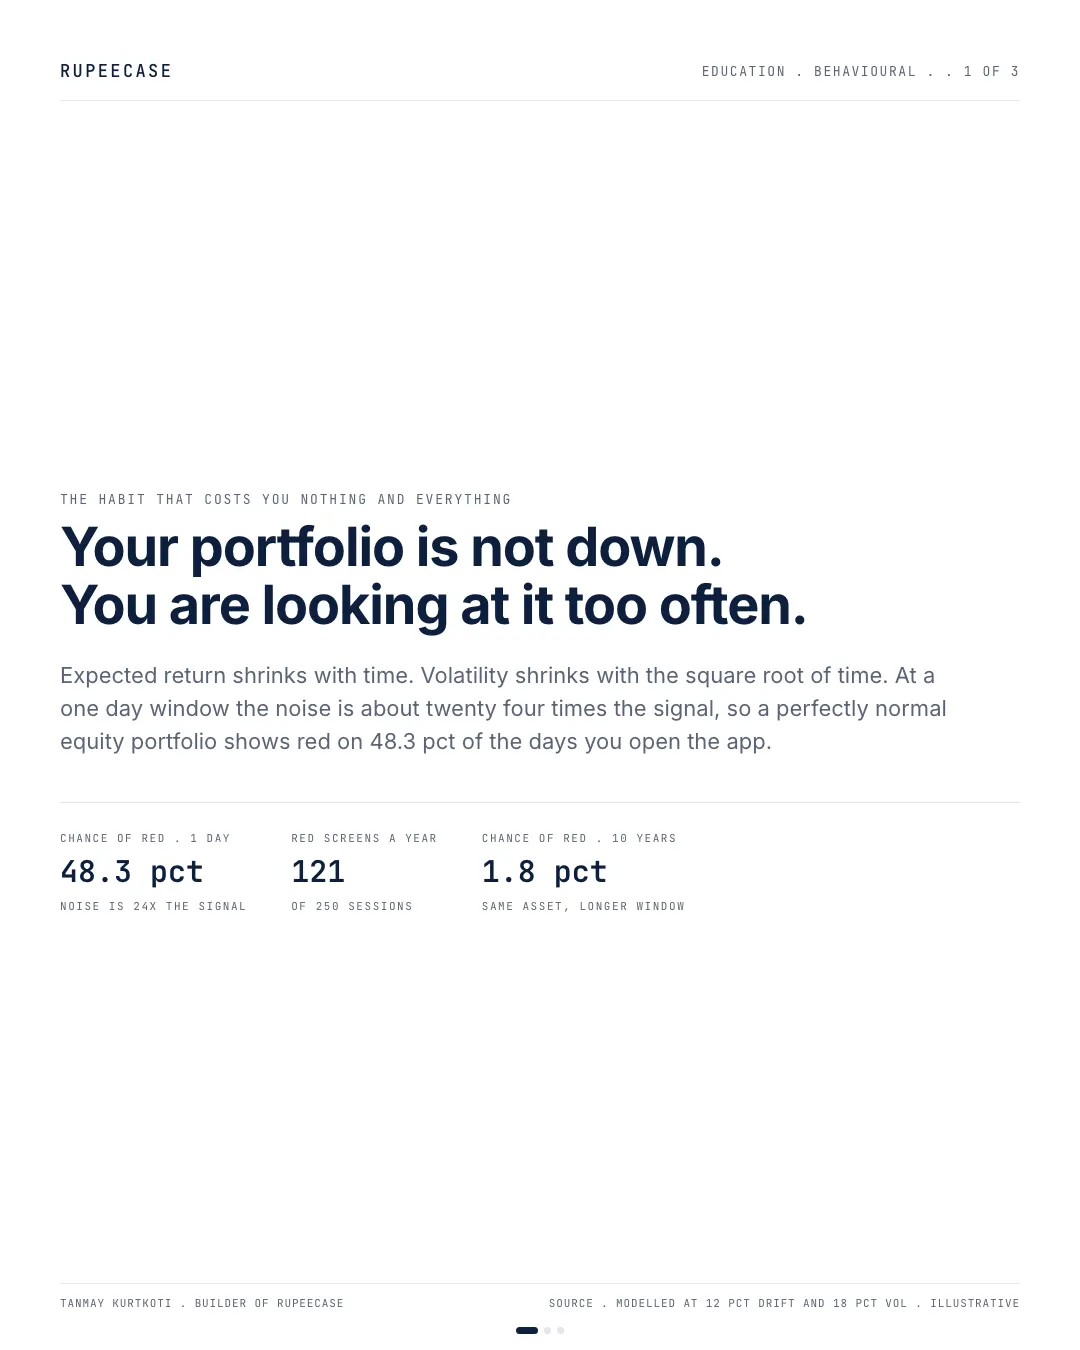
At 12 percent drift and 18 percent volatility a day's wobble is 24 times the signal, a normal year shows about 121 red days, and the crossover sits at 2.25 years.
By Tanmay Kurtkoti, founder of QC Alpha and builder of RupeeCase
My brother in law has a habit. Every time the car stops at a signal, out comes the phone, open goes the app, and there is the number. Green or red. Then the light changes and the phone goes back into the pocket.
Last Tuesday he did it four times between Bandra and Lower Parel. Three of the four were red. By the time we parked he had decided that something had gone wrong with the fund.
Same fund. Same holding. Same eleven months of him doing absolutely nothing wrong.
He was not measuring the fund. He was measuring how often he looked.
At a traffic light the noise is twenty four times the signal
Take a plain equity portfolio. Assume it drifts up at 12 percent a year with 18 percent annual volatility, which is roughly the shape of a diversified Indian equity book over long stretches. Both numbers are annual. To see what a single day looks like you have to shrink them, and they do not shrink at the same speed.
The return shrinks by time. Twelve percent over 250 trading sessions is 0.048 percent a day.
The volatility shrinks by the square root of time. Eighteen percent divided by the square root of 250 is 1.14 percent a day.
So on any given day the wobble is about twenty four times larger than the drift. At a one year window that ratio falls to 1.5. At ten years it falls to 0.47, and only then does the thing you are actually invested for become bigger than the thing that is distracting you.
That is the whole article in three numbers. Everything below is just evidence.
A hundred and twenty one red days is a normal year, not a bad one
Run the same assumption through a normal distribution and ask a simple question: what is the chance the number is red when I open the app?
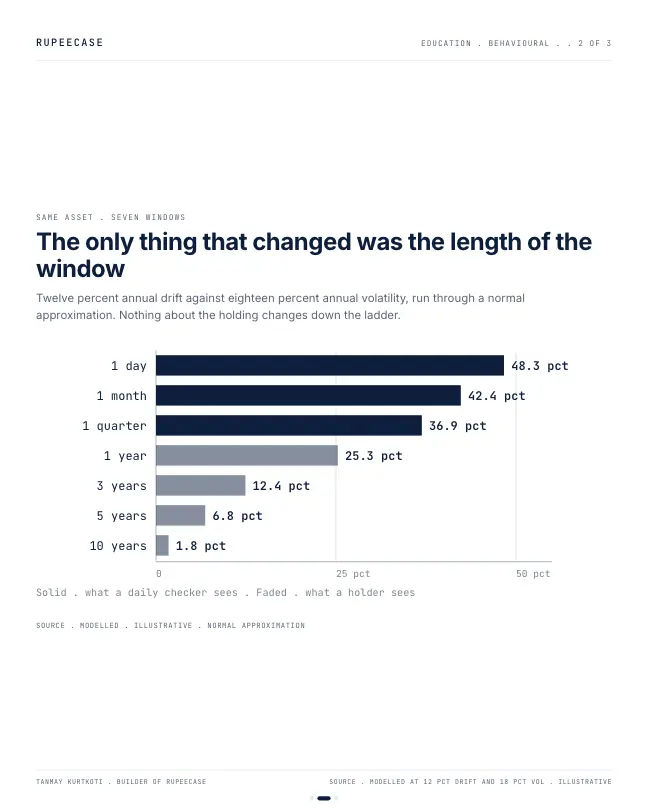
Open the app on a random trading day and you have a 48.3 percent chance of seeing red. Not because anything is wrong. Because that is what a coin flip with a very small thumb on the scale looks like. Multiply that by 250 sessions and a completely normal year hands you about 121 red days.
The solid bars are what a frequent checker experiences. The faded bars are what a holder experiences. Same asset. Same assumption. Same arithmetic. The only variable that changed was the length of the window.
The table the app will never show you
Put the drift and the wobble side by side and the mechanism stops being abstract.
| Holding window | Expected move | Typical swing | Chance of red |
|---|---|---|---|
| 1 day | 0.05 pct | 1.14 pct | 48.3 pct |
| 1 month | 1.00 pct | 5.20 pct | 42.4 pct |
| 1 year | 12.00 pct | 18.00 pct | 25.3 pct |
| 5 years | 60.00 pct | 40.25 pct | 6.8 pct |
| 10 years | 120.00 pct | 56.92 pct | 1.8 pct |
Look at the middle two columns. At one day the typical swing is twenty four times the expected move. At five years the expected move finally overtakes the swing, and at ten years it is more than double it.
You can pin the crossover exactly, and the arithmetic is small enough to do standing up. The ratio of swing to drift is 1.5 divided by the square root of the window measured in years. That hits one when the square root hits 1.5, which puts the crossing at 2.25 years. Two years and three months. That is the moment the thing you invested for finally becomes larger than the thing distracting you, and almost nobody in the country has an app notification set for it.
I made him guess, and he was not close
Two Sundays ago I put a laptop on his kitchen table and asked him to guess. In a normal year, a good year, a year where the fund does exactly what it was bought to do, how many days does the app show red?
Forty, he said. Maybe fifty on a rough one.
It is 121. He had already lived through most of them without noticing, because a red day you did not look at costs you nothing at all.
Then we counted his looks. Four at signals, one at breakfast, one at eleven at night that he insists does not count. Call it four a session. Across 250 sessions that is 1000 openings of the same app in a year, and at 48.3 percent about 483 of them hand him a number he does not like.
Four looks inside one day are not four independent draws, and you might think that saves him. Count it the other way, 121 red days seen four times each, and you land on 484. The two numbers sit within one of each other, which is the sort of coincidence that tells you the answer does not depend on which story you prefer.
483 unpleasant little moments a year, on a holding he has no plan to sell for a decade.
Two people, one fund, two completely different lives
Benartzi and Thaler gave this a name in 1995. Myopic loss aversion. We feel a loss roughly twice as hard as we feel a gain of the same size, and the more often we evaluate, the more losses we collect. The evaluation period, not the asset, decides how painful an asset feels.
The daily checker has to absorb 121 small emotional bruises to earn the same twelve percent the annual checker earns while paying attention to something else. And it is worse than a simple count, because loss aversion is asymmetric. One hundred and twenty one reds do not net off against 129 greens. They weigh about twice as much.
Put a ledger on that. 129 green sessions at a weight of one is 129 units of quiet satisfaction. 121 red sessions at a weight of two is 242 units of the other thing. The year nets out 113 units under water, in twelve months where the money went up. Drawn side by side, one perfectly ordinary year looks like this.
The weight of two is arguable and I would not defend it to a decimal. The sign is not arguable. Checked daily, a good year is lived as a bad one, and it is the living that people act on.
That is the real cost of the traffic light habit. Not the number on the screen. The number of times you were asked to make a decision you had no business making.
Where this argument breaks
Four places, and I want to be straight about all four. The first one is fatal.
If any part of your book is funded with borrowed money, or sits against a margin obligation, or carries a derivative leg that is marked to market every evening, none of the above applies to you. The mechanism is not the one people expect. Borrowing does not move the noise to signal ratio by a single point. Double the position and the drift doubles to 0.096 percent a day, the swing doubles to 2.28 percent a day, and 24 stays 24. What borrowing changes is whether you get to keep the window at all. A margin call does not respect your evaluation period. It picks one for you, and it picks the worst one available. If somebody else can close your position, you do not own a long window. You own a short one that nobody has told you about.
The second is that never looking is not the goal. A portfolio you never open is a portfolio where a wrong nominee, a lapsed mandate, an unnoticed style drift or an account you forgot to reassign quietly sits for years. There is a difference between monitoring a process and grading an outcome. Reading a rebalance note is monitoring. Reading a percentage before your chai is grading, and it grades the wrong thing.
The third is that the model above assumes normal returns and a constant drift. Real markets have fat tails and long flat stretches. A five year window with a 6.8 percent modelled chance of red is not a promise. Anyone who held Indian equity from January 2008 through 2013 can tell you what the tail feels like from the inside. What holds up across every distribution I have looked at is the direction, not the exact decimal. Longer windows lower the odds of seeing red. They do not remove them.
And the fourth is a thing the model cannot capture at all. Some people genuinely sleep worse not knowing. If checking daily is what lets you stay invested at all, check daily. A slightly worse process you actually follow beats a better one you abandon in March.
Here is what would change my mind. Show me a matched sample, same funds, same entry dates, same holding period, one group checking daily and one checking quarterly, and the daily group ending with the higher realised return once its own behaviour is counted. Not paper return. Realised. I have looked and not found it, and I would rather be shown wrong than stay right by default.
The uncomfortable implication for what equity has to pay you
There is a follow on to this that I find genuinely interesting, and it is the reason the 1995 paper mattered to economists rather than just to nervous investors.
If people evaluate their portfolios roughly once a year, and if losses hurt about twice as much as equivalent gains feel good, then you can work backwards and ask what equity premium would make a typical person indifferent between holding equity and holding a safe asset. Benartzi and Thaler ran that exercise and found the answer lands close to the premium equity has actually paid.
Which flips the usual story. The equity premium is not only compensation for the risk that equity carries. Part of it is compensation for how often we look at it.
That has a consequence people rarely draw out. If the premium is partly a fee the market pays you for tolerating frequent bad news, then a person who genuinely does not look is being paid for a discomfort they never experience. They are collecting the premium without paying the psychological price that justifies it. The lengthened window is not just a coping strategy. It is close to an edge, and it is available to anyone, for free, and it requires doing less rather than more.
Follow it one more step. The wobble a daily checker reacts to is not weather blowing in from outside the market. A good part of it is other daily checkers, reacting. So the noise you are being paid to tolerate is partly manufactured by people doing exactly what you are doing.
Which also means it is only free while it is rare. If a whole cohort lengthened its window tomorrow, some of that short term wobble would simply stop being generated, and the slice of the premium that paid for tolerating it would compress along with it. A behaviour everyone adopts stops being an edge and becomes the baseline. Not an argument for checking. An argument for noticing that you are currently being paid, in a small way, out of somebody else's anxiety.
I cannot prove that in a way that would satisfy a referee, and the literature argues about the size of the effect rather than the direction. What I am confident about is the sign. Nobody has ever produced evidence that watching a diversified portfolio more often improves the outcome.
Three rules I would give my brother in law
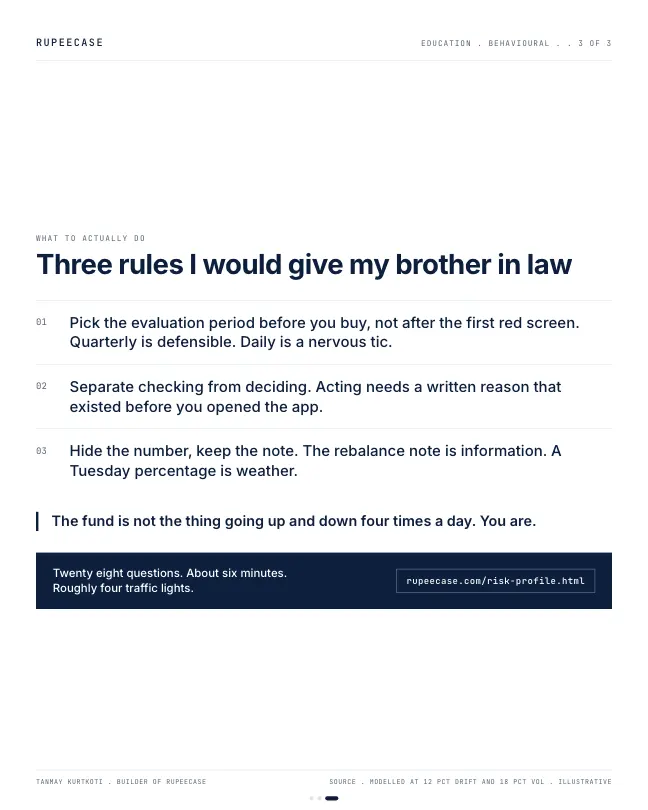
Pick your evaluation period before you buy, not after the first red screen. Write it on the same page as the buy decision. Quarterly is defensible. Daily is not an evaluation period, it is a nervous tic.
Separate checking from deciding. Looking is free. Acting on what you looked at should require a written reason that existed before you opened the app. If you want the fit question settled properly, the risk profile wizard asks it in twenty eight questions and takes about six minutes, which is roughly four traffic lights.
Turn off the number and keep the note. Most platforms let you hide the portfolio value on the home screen. The rebalance and process notes are the part worth reading. The percentage on a Tuesday afternoon is not information, it is weather.
He asked me on the way home whether he should just delete the app. Bad idea, and also not the point.
Keep the app. Change the window. The fund is not the thing that has been going up and down four times a day since January. You are.
Questions readers ask
What is the short answer?
At 12 percent drift and 18 percent volatility a day's wobble is 24 times the signal, a normal year shows about 121 red days, and the crossover sits at 2.25 years.
Where can I learn behaviour properly?
In the free RupeeCase Learn library: Behaviour, learn it free, no sign up needed. Modules come with quizzes, calculators and a path test.
Is this note investment advice?
No. It is an educational note by Tanmay Kurtkoti. RupeeCase is a technology platform, not a fund, a PMS or a SEBI registered investment adviser.
The cards
3 cards. Swipe, or tap to open.
Explore next
Learn it properly, then see it applied.
Related
- Myopic loss aversion: the price of lookingAn index that climbs over the long run still closes red almost half of its days, about 2 in 5 months and 1 in 4 years, and a loss stings about 2.25 times a gain.Behaviour . . 5 min
- Ten days that matteredRs 10 lakh in the Nifty 50 TRI from July 1999 grew to Rs 2.84 crore, or Rs 96 lakh without the 15 best days, seven of which sat within two weeks of the ten worst.Behaviour . . 8 min
- Selling the wrong halfTwenty equal positions with winners sold at plus 20 and losers held to minus 40 end down 10 percent; flip the exit rule and the same picks end up 10, and doing nothing ends flat.Behaviour . . 10 min
Educational content only. Figures are illustrative and computed on historical or representative data for teaching purposes, not investment advice. Past performance does not guarantee future returns. Sourced from NSE, BSE, SEBI, AMFI and RBI public data.