

Returns and risk maths..11 min read
The average return is a lie
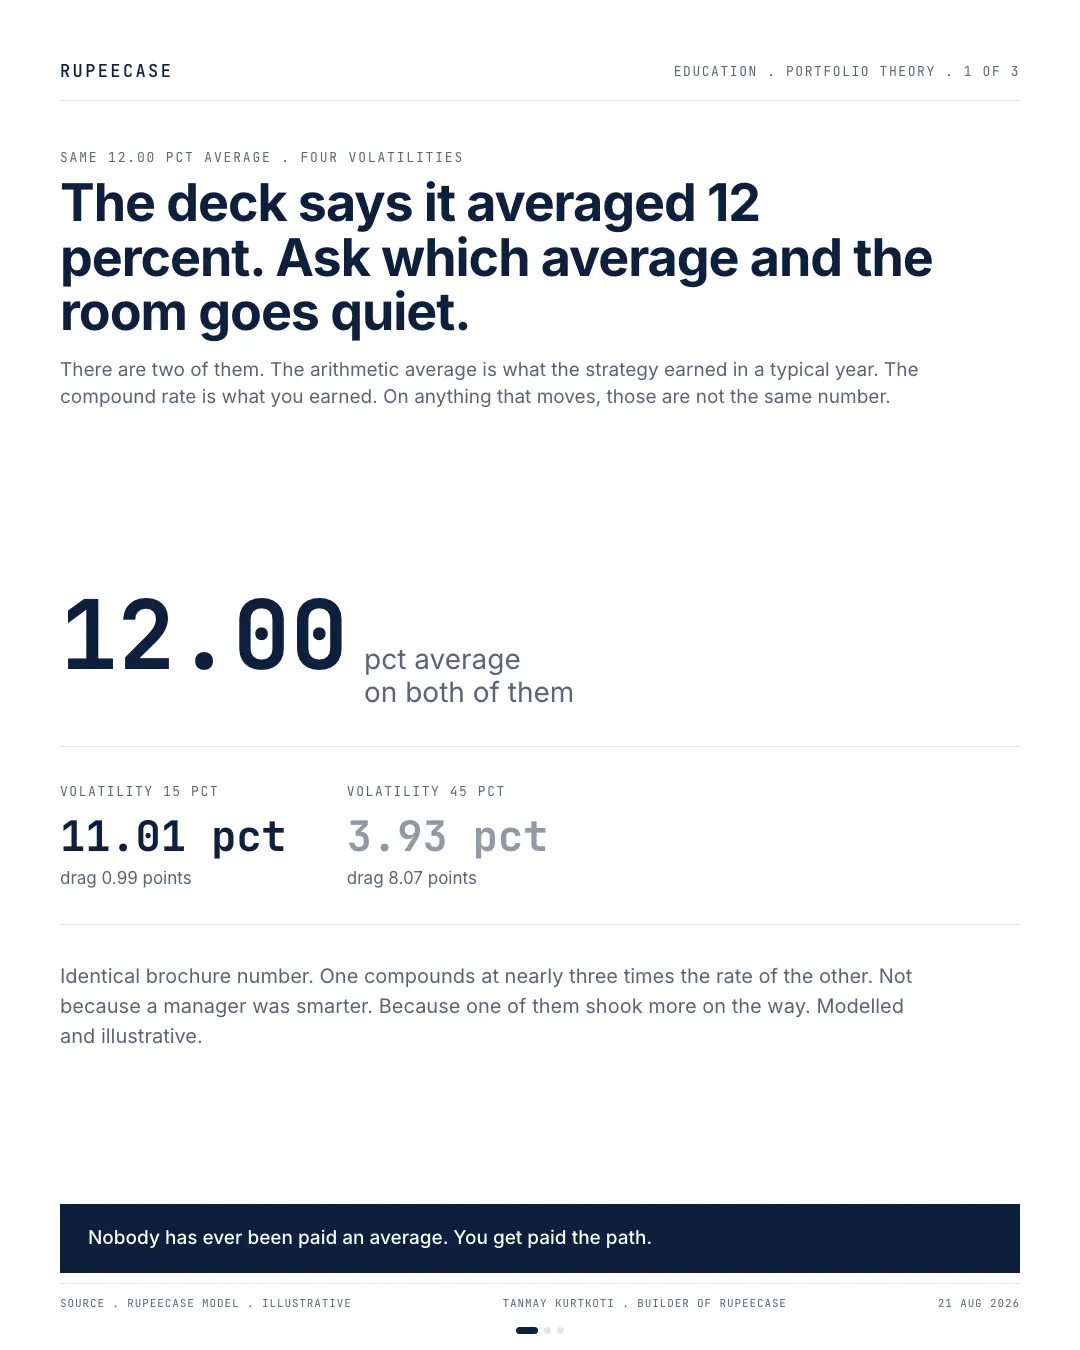
Plus 30, minus 20, plus 25, minus 15 averages 5.00 percent and compounds at 2.53, and a 12 percent average at 45 percent volatility compounds at 3.93.
By Tanmay Kurtkoti, founder of QC Alpha and builder of RupeeCase
Thursday afternoon, a conference room in Lower Parel, slide three of a pitch deck. The strategy averaged 12 percent over the last decade. Everybody nods. I put my hand up and ask which average.
The presenter says sorry, which what.
Which average. The one you add up and divide, or the one your money actually grew at. And the room goes quiet in that particular way a room goes quiet when a question that sounded pedantic turns out to have been a real one.
I have asked this in maybe a dozen meetings. About half the time the answer is that they are the same number. They are not. On a calm strategy they sit close enough that nobody gets hurt. On a bumpy one the gap is larger than most fee arguments I have ever sat through.
So I built the smallest model I could think of and ran it. Hold the arithmetic average fixed at 12 percent. Change nothing at all except how much the returns bounce around on the way. Then ask what the money did.
The average return is what the strategy earned in a typical year. The compound return is what you earned.
Nobody has ever been paid an average. You get paid the path.
Two numbers, and only one of them ends up in your account
The proof needs no formula and no software. Start with Rs 100. Year one it rises 50 percent, so you hold Rs 150. Year two it falls 50 percent, so you hold Rs 75.
Add the two returns and divide by two. Plus 50 and minus 50. The arithmetic average is exactly zero.
Now look in the envelope. You have 0.75 times your money. You are down 25 percent.
Nobody lied to you. The average really is zero. The average of the returns and the return on your money are simply two different calculations, and the second one multiplies where the first one adds. A fall and a rise of the same percentage are not the same amount of money.
That gap has a formal name, the distance between an arithmetic and a geometric mean, and a better working name. It is a drag. It is charged every year, it shows up on no statement, and it is paid in full by whoever is holding the thing that moves.
Four years that flatter themselves by a factor of two
Fifty up and fifty down is a party trick. Nobody markets a strategy that does that. So here is a sequence that could plausibly sit inside a real factsheet: plus 30, minus 20, plus 25, minus 15. Two good years, two bad ones, nothing you would call extreme.
Add them and divide by four and the arithmetic average is exactly 5.00 percent a year. Not thrilling, not embarrassing, the sort of number that survives an investment committee without a follow up question.
Now multiply instead of adding. Rs 100 becomes 130, then 104, then 130 again, then 110.50.
The dashed line is the promise. The solid line is the money. Over the four years you made 10.50 percent in total, which works out to a compound rate of 2.53 percent a year against a stated average of 5.00. The average did not overstate your result by a rounding error. It overstated it by roughly a factor of two, on a sequence nobody would describe as wild.
The same brochure number, four completely different products
Back to the model. Twelve percent arithmetic average on every one of them. The only thing that changes is how hard the returns swing.
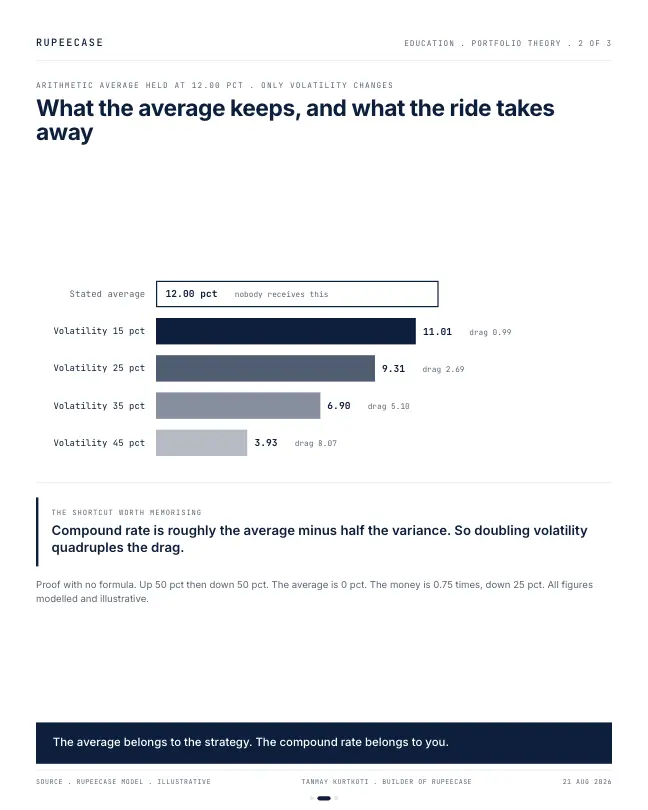
The hollow bar on the left is the number on the slide, drawn empty because nobody receives it. The four solid bars are what the money compounds at once the bouncing is paid for. At 15 percent volatility, roughly a diversified large cap portfolio in an ordinary decade, you keep 11.01 and give up 0.99 of a point. I would not write anything about that. At 45 percent volatility, which is not an exotic reading for a concentrated small cap book, a stated 12 turns into 3.93.
Read that twice. Two products, the same average return on the brochure, and one compounds at nearly three times the rate of the other. Not because a manager was smarter. Because one of them shook more on the way.
The shortcut that fits in your head, and the place it stops fitting
You do not need a spreadsheet to catch this in a meeting. The compound return is roughly the average minus half the variance, variance being volatility squared. At 25 percent volatility that is half of 0.0625, so 3.13 points, so 12 minus 3.13 gives about 8.88 against a true 9.31. Close enough to say out loud while somebody is still on slide three.
| Volatility | Compounds at | Quick shortcut | Drag |
|---|---|---|---|
| 15 pct | 11.01 pct | 10.88 pct | 0.99 points |
| 25 pct | 9.31 pct | 8.88 pct | 2.69 points |
| 35 pct | 6.90 pct | 5.88 pct | 5.10 points |
| 45 pct | 3.93 pct | 1.88 pct | 8.07 points |
The column that matters is not the middle one. It is the shape of the last one. The drag scales with the square of volatility, so doubling volatility quadruples the drag. Moving from 15 to 30 does not cost you twice as much, it costs you four times as much, and intuition, which is stubbornly linear, gets this wrong every single time.
Here is the bit that caught me out. The shortcut is a good friend in the top half of that table and a liar in the bottom. At 45 percent it predicts 1.88 when the honest answer is 3.93. It over-charges by more than two full points exactly where the stakes are highest, which means the mental model that makes you appropriately wary of volatility also makes you wary by the wrong amount. Use it to sort candidates. Do not use it to price one.
It runs backwards too, which is how I check myself. The four-year sequence from earlier sits about 22.6 percent away from its own average. Half of that squared is 2.56 points, and 5.00 minus 2.56 gives 2.44 against a real 2.53. The shortcut found the answer without being told the answer.
Twenty years of the same average, two very different piles of money
Percentages are easy to nod along to. Money is harder to argue with. So take Rs 10 lakh, hold it for twenty years, and let it compound at the two ends of that ladder.
Same twelve on both slides, and the steadier path finishes at about Rs 80.77 lakh against about Rs 37.98 lakh for the bumpier one. It does not finish a little behind. It finishes with less than half the money. What is unfair about that chart is its left half. The two lines sit almost on top of each other for the first five years, precisely the window in which a buyer decides whether any of this matters. By the time the gap is visible you have already lived through most of the ride you were trying to judge.
What this does to the way people buy, and what happens when everyone does it
The first-order lesson is easy once you have seen it. Stop comparing averages, compare compound rates, and treat volatility as a charge rather than a mood. It also reorders how you size things. If the drag is quadratic, trimming the wildest sleeve of a portfolio buys back more compound return than adding to the calmest one, which is the real reason a risk setting is a portfolio decision rather than a personality quiz.
The second-order consequence is the one I keep turning over. If enough buyers start demanding the compound number next to the average, sellers will respond, and the cheapest way to close that gap is not to reduce risk. It is to reduce measured volatility. Mark a book once a quarter instead of once a day and reported volatility falls without a single unit of risk leaving the building. Hold things that rarely trade and your price series is smooth by construction.
Which means a near zero gap between the average and the compound number is either a genuinely steady portfolio or a portfolio that is not being measured often enough, and from the outside those two look identical. So the test I actually trust is not the size of the gap. It is whether the volatility was computed from prices a stranger could have transacted at.
Where this argument stops working
Three limits, and the first one is not a hedge.
The arithmetic mean is not wrong. It is the right answer to a different question. If you want the expected return of the next single year, the arithmetic mean is the number you want and the compound rate will understate it. The compound rate only becomes correct once you are stringing periods together and letting them multiply. Ask a one-period question, get an arithmetic answer.
Second, everything above is a lump sum and hold argument and should be labelled as one. If you are putting money in every month, volatility along the path is not purely a cost. The same instalment buys more units when the price is down, so a bumpy road can leave a regular contributor ahead of where a smooth road would have left them. Same market, opposite conclusion, because the cash flow timing is different. A monthly contribution plan and a lump sum are not the same investor and should not be handed the same warning.
Third, the model assumes returns behave in a well mannered statistical way with a volatility that stays put. Real markets have quiet years and violent ones, and the drag in a live portfolio arrives lumpy rather than as a tidy annual charge. Every figure here is modelled and illustrative. None of it is a track record and none of it is a forecast.
And here is what would change my mind about a specific product. If a fund published its average and its compound number and the two came out nearly identical, then its realised volatility was genuinely low and none of this criticism lands on it. That is the test. Not the pitch, the two numbers sitting next to each other.
Three things I do with this now
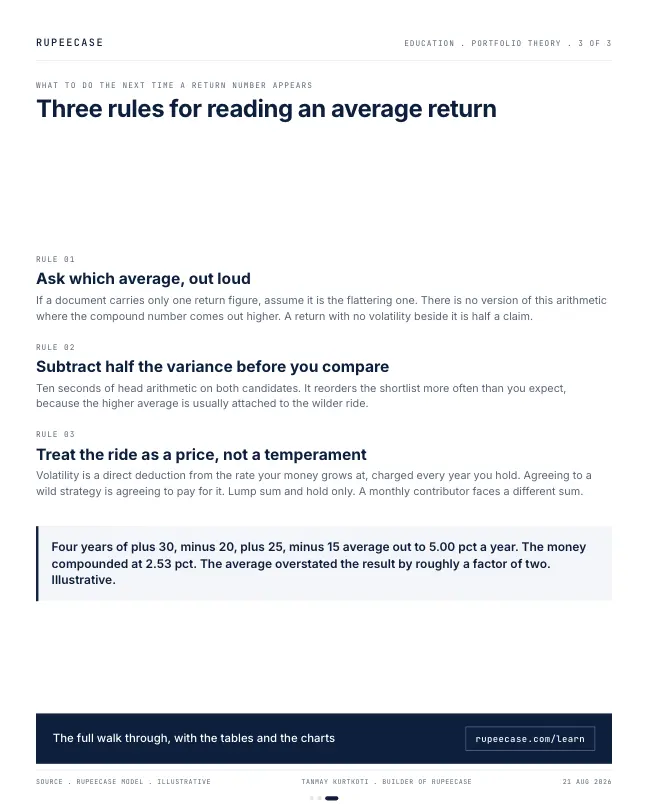
Ask which average, out loud, the first time a return number appears in the room. If a document carries only one, assume it is the flattering one, because there is no version of this arithmetic where the compound number comes out higher. A single return figure with no volatility beside it is not a performance claim. It is half of one.
Do the subtraction before you compare anything. Half the variance, off the top, on both candidates. It takes ten seconds and it reorders the shortlist more often than you would expect, because the thing with the higher average is usually the thing with the wilder ride.
Treat the ride as a price rather than a temperament. Volatility is not only about whether you sleep. It is a direct deduction from the rate your money grows at, charged every year you hold the position, and anyone who says they can stomach a wild strategy has just agreed to pay for it whether or not they realised that is what they said.
The deck was not lying. It said twelve percent and it meant twelve percent, in the only sense that phrase carries when nobody asks the follow up question.
So ask it. The average belongs to the strategy. The compound rate belongs to you. On anything that moves, those are different numbers, and the difference is never paid by the person holding the clicker.
Questions readers ask
What is the short answer?
Plus 30, minus 20, plus 25, minus 15 averages 5.00 percent and compounds at 2.53, and a 12 percent average at 45 percent volatility compounds at 3.93.
Where can I learn returns and risk maths properly?
In the free RupeeCase Learn library: Returns and risk maths, learn it free, no sign up needed. Modules come with quizzes, calculators and a path test.
Is this note investment advice?
No. It is an educational note by Tanmay Kurtkoti. RupeeCase is a technology platform, not a fund, a PMS or a SEBI registered investment adviser.
The cards
3 cards. Swipe, or tap to open.
Explore next
Learn it properly, then see it applied.
Related
- The volatility taxFive portfolios averaging 12 percent compound at 11.98 down to 4.00 percent depending only on volatility, so Rs 10 lakh over twenty years ends anywhere from Rs 96 lakh to Rs 22 lakh.Returns and risk maths . . 8 min
- Average return vs CAGRUp 50 then down 50 averages zero and loses a quarter of the money, and two funds averaging 12 percent at 8 and 30 percent volatility end twenty years at Rs 91 lakh and Rs 42 lakh.Returns and risk maths . . 5 min
- Volatility drag: same average, six lakh gapTwo funds printing a 12 percent average return ended at Rs 28.4 lakh and Rs 21.8 lakh on the same Rs 10 lakh, because the drag scales with volatility squared.Returns and risk maths . . 6 min
Educational content only. Figures are illustrative and computed on historical or representative data for teaching purposes, not investment advice. Past performance does not guarantee future returns. Sourced from NSE, BSE, SEBI, AMFI and RBI public data.