

Returns and risk maths..11 min read
Same returns, different retirement
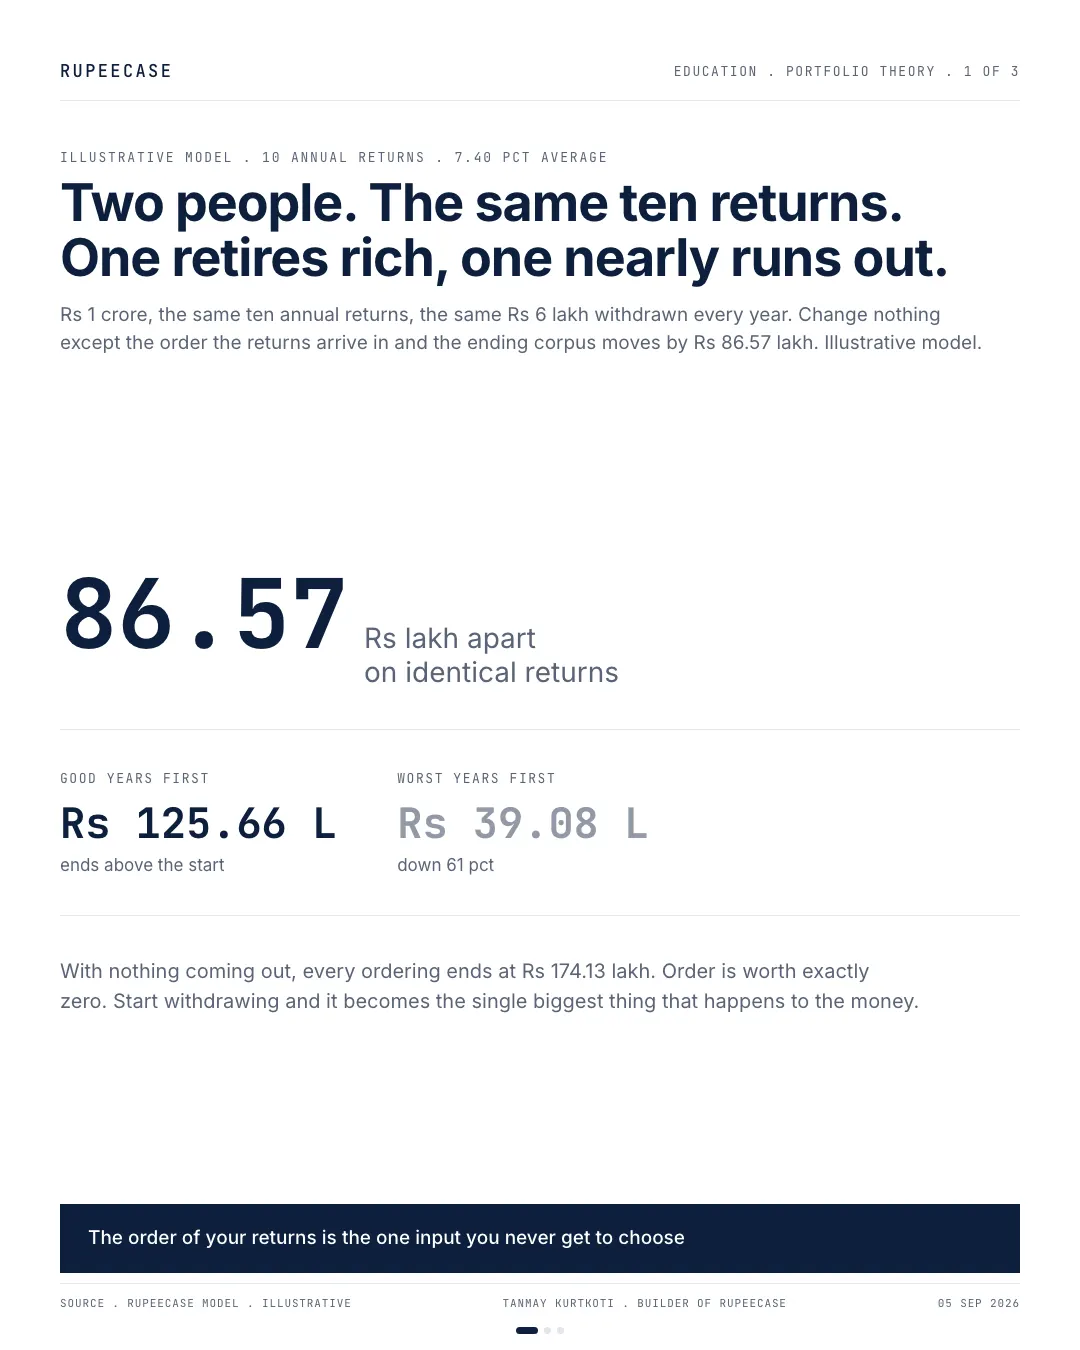
The same ten annual returns leave a Rs 1 crore corpus drawing Rs 6 lakh a year at Rs 125.66 lakh or Rs 39.08 lakh depending only on their order.
By Tanmay Kurtkoti, founder of QC Alpha and builder of RupeeCase
Wednesday evening, a call from a man who stops working in April. Sixty one, sold a small business, sitting on a corpus he is never going to add to again. He had a spreadsheet open while we talked and he read the logic out to me the way you read out a court judgment.
Average return 7.40 percent a year. Withdraw 6 percent a year. Six is smaller than seven point four, so the corpus grows slowly forever and he dies richer than he retired. Where, he wanted to know, is the catch.
I asked him to send me the ten annual returns he had used. Then I put the same ten numbers into the same spreadsheet in a different order and sent it back.
Nothing about the investments changed. Not the returns, not the corpus, not the withdrawal. He ends with Rs 39.08 lakh instead of Rs 125.66 lakh.
Ten numbers, and the only thing I changed was the order
The model is small enough to say in one sentence. Take ten annual returns, apply them to Rs 1 crore, and see what the order does to the ending number.
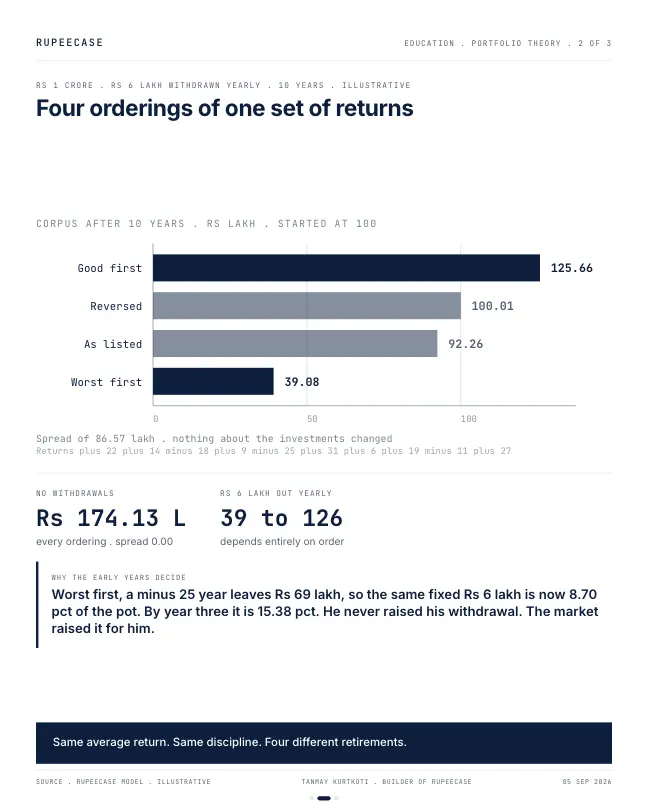
The ten, all illustrative, a decade I made up to be ordinary rather than dramatic: plus 22, plus 14, minus 18, plus 9, minus 25, plus 31, plus 6, plus 19, minus 11, plus 27. Three down years out of ten. Worst one minus 25. No crash of the century, no lost decade, nothing you would write a book about.
Their simple average is 7.40 percent. Multiplied together they come to 1.7413 times.
Here is the part everyone already knows and almost nobody follows through on. Put Rs 1 crore in, take nothing out, and you end with Rs 174.13 lakh. In that order. In reverse. Worst years first. Good years first. Shuffled a thousand different ways, and I did shuffle them. Rs 174.13 lakh, every single time, to the paisa, because multiplication does not care what order you multiply in.
So while he was saving, for the thirty odd years he was building this corpus, the order of his returns was worth exactly nothing. Zero. A fact about his investing life that was completely, provably irrelevant.
And then he retires.
Order is worth exactly nothing right up until the day it is worth Rs 86.57 lakh.
Now take Rs 6 lakh a year out and watch the same ten numbers come apart
Same corpus. Same ten returns. One change: Rs 6 lakh comes out at the end of every year, which is 6 percent of what he started with. That is it. That is the entire modification.
I ran four orderings. The list as he wrote it. The list reversed. The three bad years shoved to the front. The good years shoved to the front. All illustrative, all from the identical ten numbers.
Look at where the four lines start. Same dot. Look at where they end. The chart is the argument, and the argument is that four people with identical portfolios and identical discipline can arrive at four different retirements, and the thing that separated them is a shuffle none of them controlled.
The gap is Rs 86.57 lakh and nobody made a single different decision
Put the four endings in a table and the size of it stops being a curve and starts being a number you can feel.
| Ordering of the same ten returns | Ends with | Gap against good years first |
|---|---|---|
| Good years first | Rs 125.66 lakh | . |
| Reversed | Rs 100.01 lakh | Rs 25.65 lakh |
| As he listed them | Rs 92.26 lakh | Rs 33.40 lakh |
| Worst years first | Rs 39.08 lakh | Rs 86.57 lakh |
Rs 86.57 lakh between the top row and the bottom row, all of it illustrative, none of it from a different investment. Same ten returns, same 7.40 percent average, same Rs 1 crore, same Rs 6 lakh a year. The man in the top row spent his whole retirement with more money than he began with. The man in the bottom row lost 61 percent of his corpus while earning, on paper, an average of 7.40 percent a year.
Both of them, at any point in that decade, could have told you their portfolio was doing exactly what the brochure said it would do. One of them was right to feel fine about it.
What actually breaks is the arithmetic of the withdrawal itself
The mechanism is not mysterious once you follow the rupees rather than the percentages.
Worst years first means year one is minus 25. The corpus goes to Rs 75 lakh, then Rs 6 lakh walks out, leaving Rs 69 lakh. He did not change his withdrawal. But that Rs 6 lakh is now 8.70 percent of what is left, not 6. Year two is minus 18 and the corpus lands at Rs 50.58 lakh, so the same Rs 6 lakh is 11.86 percent. By the end of year three he is at Rs 39.02 lakh and his unchanged, disciplined, never once increased withdrawal has quietly become 15.38 percent of the pot.
He never raised his spending. The market raised it for him.
The ladder is the same story with the drama taken out, and what it shows is that the damage is not spread evenly across the four cases. Three of them cluster between Rs 92 lakh and Rs 126 lakh. One falls off a cliff. Sequence risk is not a smooth penalty you can budget for. It is mostly fine and then occasionally catastrophic, which is precisely the kind of risk human beings are worst at pricing.
One more detail from the worst first path, because it is the bit that surprised me. His corpus bottoms at Rs 31.00 lakh in year seven, and then the plus 31, the plus 27 and the plus 22 arrive. The three strongest years in the entire decade. They lift him to Rs 39.08 lakh. Great returns, applied to a third of the money, at the end of the story. The recovery was real and it was nearly worthless, because compounding needs a base and he had already spent his.
The same volatility that ruins the retiree is a gift to the saver
This is a risk of drawdown, not a risk of investing, and I want to be precise about who it does not apply to.
Take the same ten returns. Instead of withdrawing Rs 6 lakh a year, put Rs 6 lakh a year in, starting from zero. Sixty lakh of contributions over the decade. Run the bad years first and he ends with Rs 135.05 lakh. Run the good years first and he ends with Rs 48.48 lakh, which is less than the Rs 60 lakh he put in.
The diagram is deliberately blunt because the point is binary rather than gradual. In the left box there is one answer and the order is a curiosity. In the right box there are four answers and the order is the answer. What the diagram cannot tell you is the bit that matters most: the switch is not gradual either. It flips on the day the money starts flowing out instead of in, and for most people that day arrives with a farewell lunch and no change whatsoever to how the portfolio is built. Somebody who is still contributing gets the exact mirror image, where a rotten early decade is a gift because every instalment buys more units at a lower price. Same volatility. Opposite sign. If you are twenty nine and your portfolio is down, that is not your problem to solve, and a risk profile built for your stage should say so out loud.
What I do not know, and what would change my mind
Ten returns is a toy and I am not pretending otherwise. Real retirements run twenty five to thirty five years, and real withdrawals rise with inflation rather than sitting frozen at Rs 6 lakh, which makes the worst case worse than what I have shown, not better.
The decade is invented. I chose it to look boring on purpose, three down years and a worst year of minus 25, and every single number in this piece moves if you choose a different ten. I would not defend Rs 86.57 lakh as a general estimate of anything. I would defend the shape.
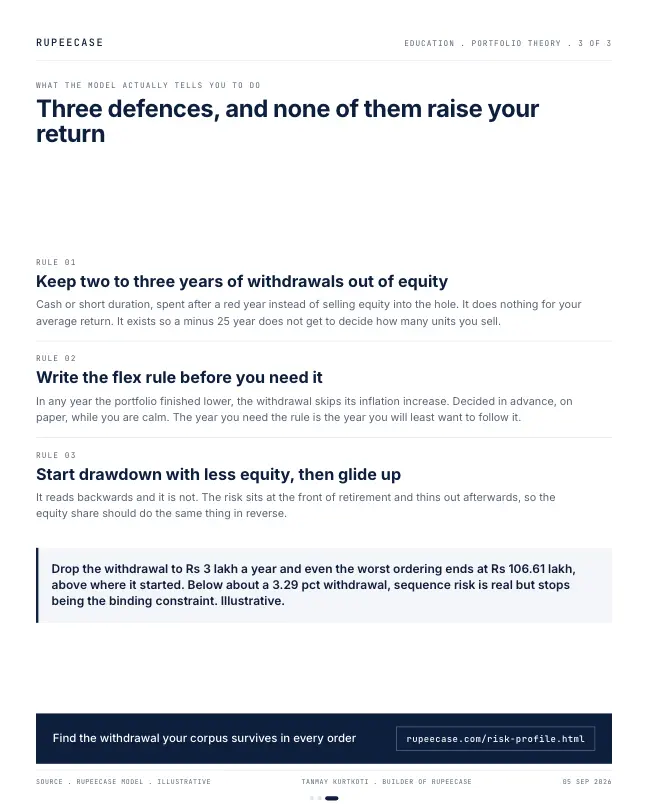
And here is what would change my mind. If the withdrawal is low enough that the corpus survives even the worst ordering, sequence risk is real but it stops being the binding constraint. Run the same worst first path at Rs 3 lakh a year instead of Rs 6 and he ends with Rs 106.61 lakh, above where he started, in the ugliest ordering available. In this decade the crossover sits at about 3.29 percent. Below that the spread still exists, still around Rs 43 lakh, but no ordering ruins him and the real planning question becomes whether he is underspending a life he only gets one of.
Nobody actually holds a withdrawal fixed while their corpus halves either. Real people cut. That flexing is a defence, which is exactly why the fixed rule version is a worst case and not a forecast.
Three things I would actually do about it
Hold two to three years of withdrawals in cash or short duration, and spend from that bucket after a red year instead of selling equity into the hole. This does nothing for your average return. It is not supposed to. It exists so that a minus 25 year does not get to decide how many units you sell.
Write the flex rule down before you need it. Something plain, like: in any year the portfolio finished lower, the withdrawal does not get its inflation increase. Decided in advance, on paper, when you are calm, because the year you need the rule is the year you will least want to follow it. Same logic as any rules based rebalancing calendar, which is that the decision is made once rather than every time it hurts.
Start drawdown with less equity than you intend to hold later, and glide up. It reads backwards and it is not, because the risk is concentrated at the front and thins out afterwards.
None of these three raise the average return. It stays 7.40 percent in all of them. All they do is protect the order, which is the variable nobody can plan around.
And then the second order problem, which nobody in the industry brings up unprompted. If an entire cohort of retirees adopts the flex rule, retirement spending across the country becomes pro cyclical. Millions of people cut consumption in exactly the years the economy is already weak, which is individually correct and collectively unhelpful. The industry has spotted this. An insurer will happily take the sequence risk off your balance sheet and onto its own, and it will price that transfer, and the price is where you should be looking hardest. Paying two percent a year to insure against a risk that only binds above a 3.29 percent withdrawal is an expensive way to feel safe. Get the withdrawal number honest first, then decide what is worth insuring.
He asked me where the catch was in his spreadsheet. The catch is that his spreadsheet had one number for the decade and the decade has ten of them.
An average describes a market. The order decides a retirement.
Questions readers ask
What is the short answer?
The same ten annual returns leave a Rs 1 crore corpus drawing Rs 6 lakh a year at Rs 125.66 lakh or Rs 39.08 lakh depending only on their order.
Where can I learn returns and risk maths properly?
In the free RupeeCase Learn library: Returns and risk maths, learn it free, no sign up needed. Modules come with quizzes, calculators and a path test.
Is this note investment advice?
No. It is an educational note by Tanmay Kurtkoti. RupeeCase is a technology platform, not a fund, a PMS or a SEBI registered investment adviser.
The cards
3 cards. Swipe, or tap to open.
Explore next
Learn it properly, then see it applied.
Related
- Sequence of returns: the order you live throughReshuffling the same ten years leaves a lump sum unchanged, ends a retiree with 28 or 140 lakh, and makes an early crash a gift for someone still paying in.Returns and risk maths . . 9 min
- The average return is a liePlus 30, minus 20, plus 25, minus 15 averages 5.00 percent and compounds at 2.53, and a 12 percent average at 45 percent volatility compounds at 3.93.Returns and risk maths . . 11 min
- The volatility taxFive portfolios averaging 12 percent compound at 11.98 down to 4.00 percent depending only on volatility, so Rs 10 lakh over twenty years ends anywhere from Rs 96 lakh to Rs 22 lakh.Returns and risk maths . . 8 min
Educational content only. Figures are illustrative and computed on historical or representative data for teaching purposes, not investment advice. Past performance does not guarantee future returns. Sourced from NSE, BSE, SEBI, AMFI and RBI public data.