



Factsheet, model back tested
Allcap factsheet
Allcap is a RupeeCase index that holds 50 stocks from the Nifty Total Market, ranked by price momentum, rebalanced every 2 weeks. Model CAGR 44.7% (back tested, as of 27 Apr 2026), minimum about ₹2,25,000 (as of 8 Aug 2026), moderately high risk band. The Allcap factsheet puts its model, back tested record on one printable page.
50 stocks from the Nifty Total Market. Fortnightly rotation.

RupeeCase strategy factsheet
Allcap
Momentum, Nifty Total Market. 50 stocks from the Nifty Total Market. Fortnightly rotation.
- CAGR
- 44.70%Nifty 50 TRI line 9.8%
- Max drawdown
- −22.72%peak to trough, model
- Sharpe ratio
- 1.68Nifty 50 0.69
- Minimum capital
- ₹2.25Labout ₹2,25,000
Model, back tested. As of 27 Apr 2026. After charges. Not a promise of future returns.
₹100 became ₹611, Jul 2021 to Jul 2026 (Nifty 50 TRI line ₹160). Log scale.
Performance, risk, efficiency
- MetricAllcapNifty 50
- Performance
- CAGR44.70%9.8%
- Cumulative return+588.18%+55.09%
- Sharpe ratio1.680.69
- Sortino ratio1.600.67
- Calmar ratio1.960.54
- Risk
- Max drawdown−22.72%−16.92%
- Volatility, a year23.58%14.15%
- Best week+8.57%+6.36%
- Worst week−10.97%−6.33%
- Efficiency
- Weeks up62.07%56.32%
- Average up week+2.73%+1.53%
- Average down week−2.48%−1.57%
Model, after charges; weekly, rolling 5 years to 13 Jul 2026. CAGR, Sharpe and max drawdown as of 27 Apr 2026.
Configuration
- Universe
- Nifty Total Market (max 5000)
- Sleeves
- Equity 100
- Holdings
- 50, equal weight in the equity sleeve
- Rebalance
- Every 2 weeks, 26 a year
- Max stock price
- ₹5,000
- Tier
- Full equity core
- Benchmark
- Nifty 50
- Minimum as of
- 8 Aug 2026
- Back test from
- 9 Jul 2021
- Metrics window
- Rolling 5 years
Calendar year returns
- 2021from Jul+14.7%
- 2022+28.8%
- 2023+99.0%
- 2024+76.5%
- 2025−4.2%
- 2026to Jul+26.6%
Model, back tested, after charges, 2021 to Jul 2026.
Deepest falls
- −22.72%20 Dec 2024 to 10 Apr 2026476 days
- −17.94%21 Jan 2022 to 5 Aug 2022196 days
- −12.42%6 Aug 2021 to 24 Sep 202149 days
- −11.58%6 Jan 2023 to 21 Apr 2023105 days
- −11.44%9 Feb 2024 to 29 Mar 202449 days
Daily model record, rolling 5 years: peak to low, days to recover.
Monthly returns
- 2021no datano datano datano datano datano data3.0−6.64.9−0.41.312.8+14.7%
- 20221.9−11.84.57.2−8.70.511.65.1−0.24.16.77.2+28.8%
- 2023−6.7−4.33.99.24.610.413.59.26.63.013.89.8+99.0%
- 202412.20.2−2.911.88.49.73.54.05.7−5.49.23.5+76.5%
- 2025−12.1−11.49.41.09.71.4−5.02.3−0.24.2−0.1−0.9−4.2%
- 2026−2.36.9−8.218.52.37.51.2no datano datano datano datano data+26.6%
Model, after charges; one calendar month per cell, in percent.
50 holdings
- Equity100%
Equal weight, 2.0% each.
- HFCL
- STLTECH
- WEBELSOLAR
- CUPID
- QPOWER
- APOLLO
- WELCORP
- ADANIPOWER
- JAYNECOIND
- GALLANTT
- TDPOWERSYS
- KRN
- ADANIGREEN
- ADANIENSOL
- AZAD
- LLOYDSME
- LLOYDSENT
- ACUTAAS
- ATHERENERG
- LLOYDSENGG
- KIRLOSENG
- GVT&D
- THERMAX
- BHEL
- COHANCE
- HCC
- KIRLPNU
- BALAMINES
- JAIBALAJI
- HSCL
- DATAPATTNS
- SCI
- SKYGOLD
- SKIPPER
- ELECON
- BSE
- PTC
- PNBHOUSING
- SYRMA
- SUZLON
- NETWEB
- DIACABS
- FINCABLES
- BANDHANBNK
- GOKULAGRO
- ASHAPURMIN
- OLAELEC
- EIEL
- ANGELONE
- PFOCUS
Weights on the rebalance day, 6 Jul 2026; they drift with prices until the next rebalance. Model portfolio, not a recommendation to buy or sell any stock.
Sector allocation
- Capital Goods18.0%
- Other, not yet mapped18.0%
- Power & Utilities16.0%
- IT & Technology12.0%
- Chemicals10.0%
- FMCG & Consumer6.0%
- Auto & Components6.0%
- Banking & Financial6.0%
- Metals & Mining4.0%
- Realty & Construction2.0%
- Energy & Oil & Gas2.0%
11 sectors in the equity sleeve.
How it works
- 1Universe
Nifty Total Market, stocks priced under ₹5,000.
- 2Rank
A risk adjusted momentum composite scores every stock.
- 3Select
The top 50 names, equal weighted.
- 4Rebalance
Every 2 weeks: names out are sold, entrants bought, the list published.
Costs
- Platform fee
- 0.2% of traded value per rebalance; no AUM or performance fee, no lock in
- A year on the minimum, about
- ₹5,000 (2.2% of capital): 27 rebalances in the year to 3 Jul 2026, about 11.1 times the portfolio traded (sales and purchases), model record
- Inside the back test
- Gross +623.74%, costs −94.55 pts, net +529.19%, rolling 5 years to 13 Jul 2026
- Broker side
- Brokerage, STT, exchange charges, GST
Rebalance record
- Published rebalances
- 135, 14 May 2021 to 3 Jul 2026
- Names on the latest list
- 60 (target 50)
Every list is public, with the names in and out.
RupeeCase is a technology platform, not a fund, a PMS or a SEBI registered investment adviser. Model figures are back tested, after estimated charges, and are not actual client returns or a promise of future returns; capital can be lost. Prices: NSE BhavCopy; the back test deducts brokerage, STT, exchange charges and GST. https://www.rupeecase.com/strategies/factsheets/allcap
02The PDF
Email me the PDF.
No sign up to read; Print saves a PDF. Leave an email for a copy and a note when Allcap rebalances. Two emails a month at most.
Noted on this device. Print saves the PDF any time.
In the app
How a strategy is chosen.
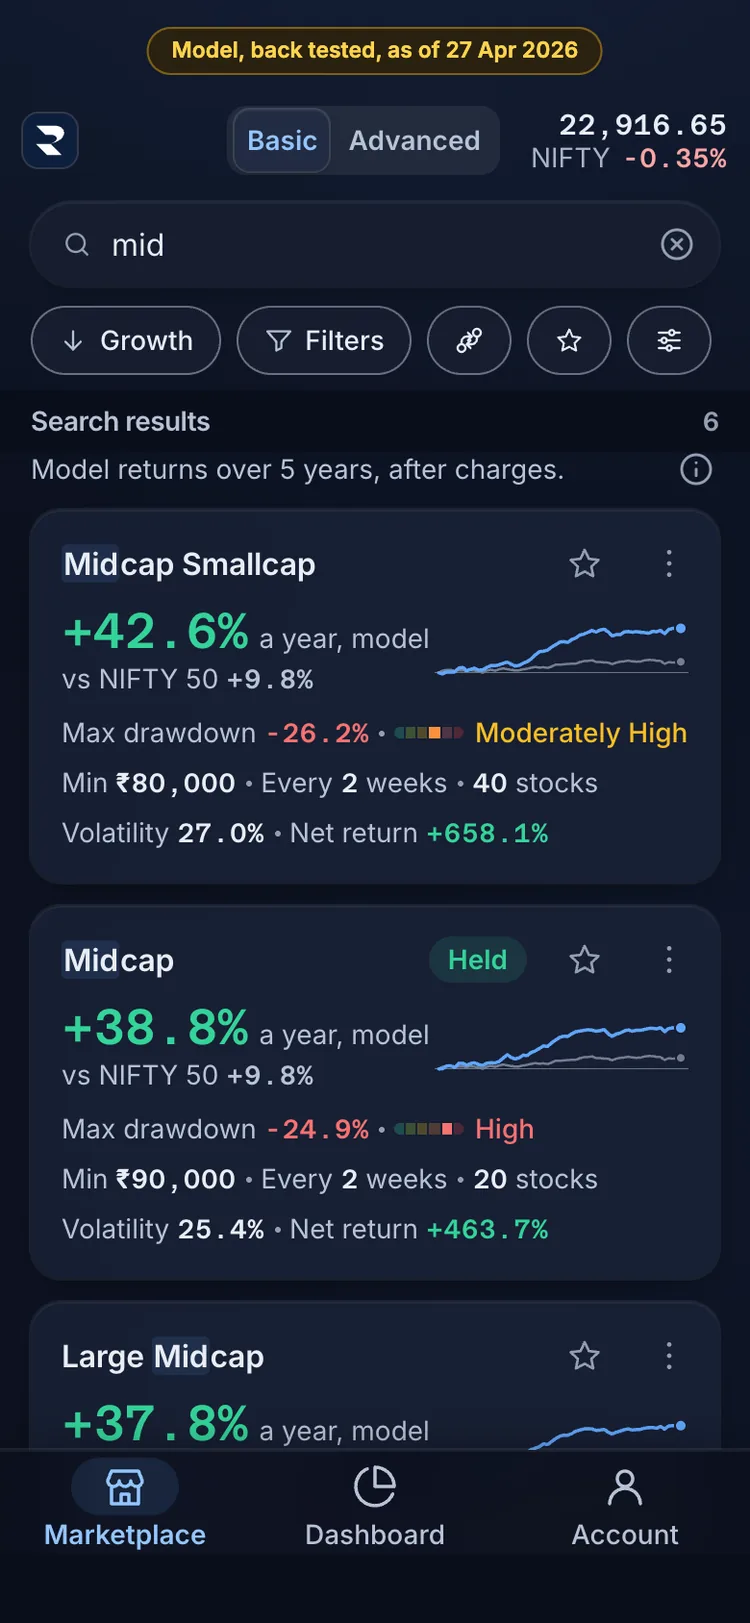
1Search finds strategies by name, theme or type: here, mid. 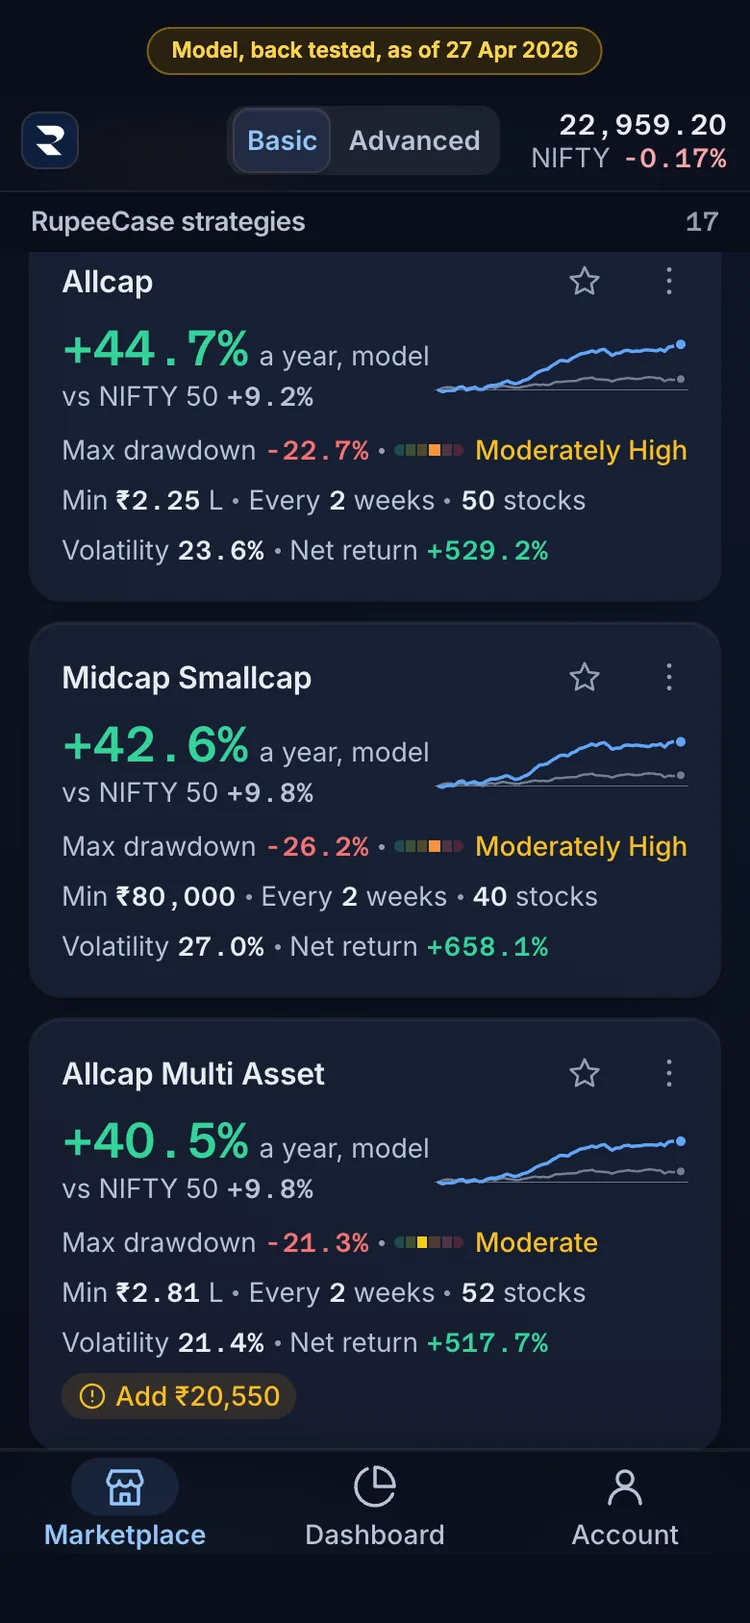
2Each card: growth per year beside the NIFTY 50, max drawdown, risk band, minimum, rebalance and stocks. 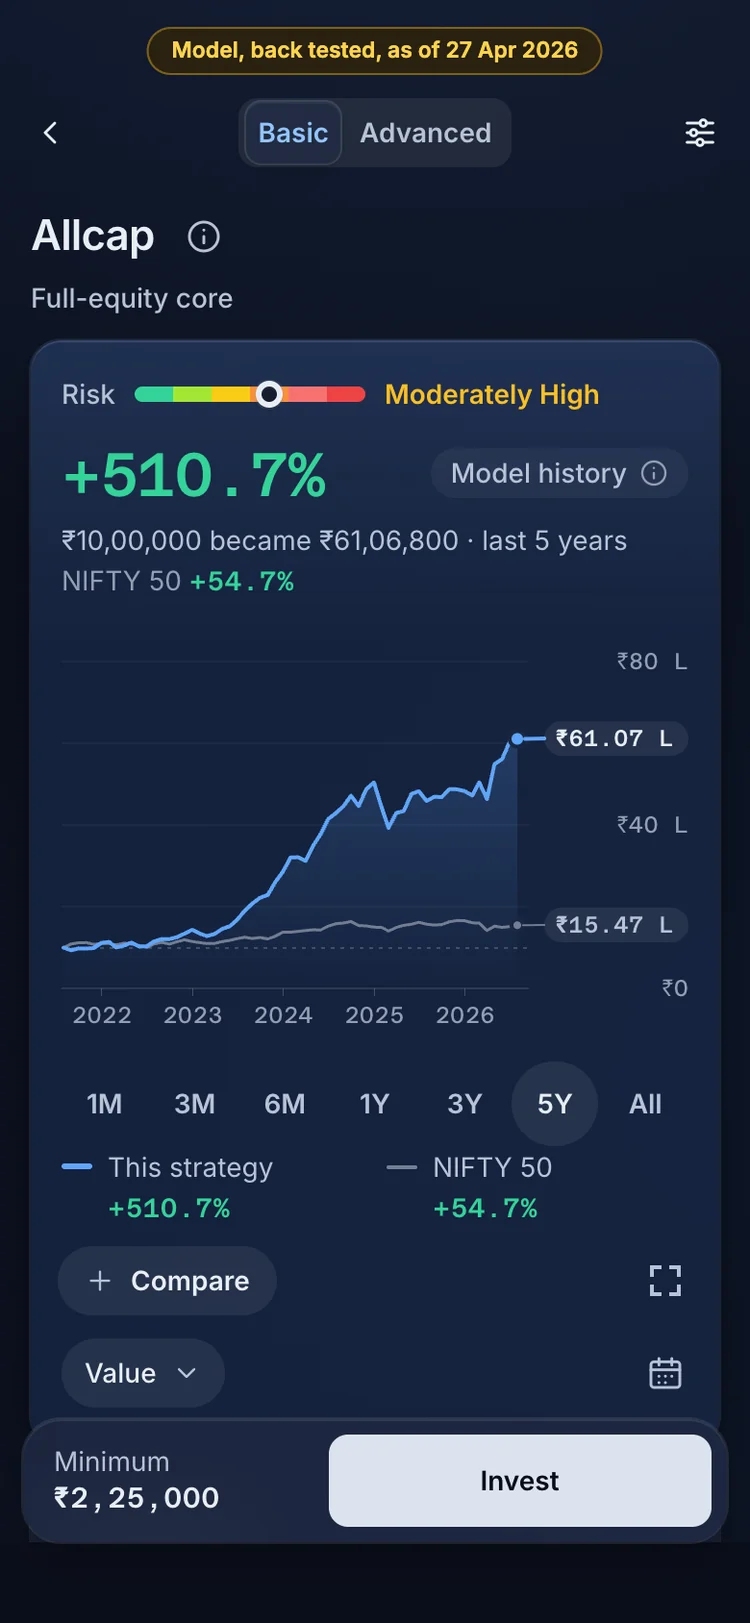
3The strategy page: model history after charges, the NIFTY 50 beside it, and the risk band. 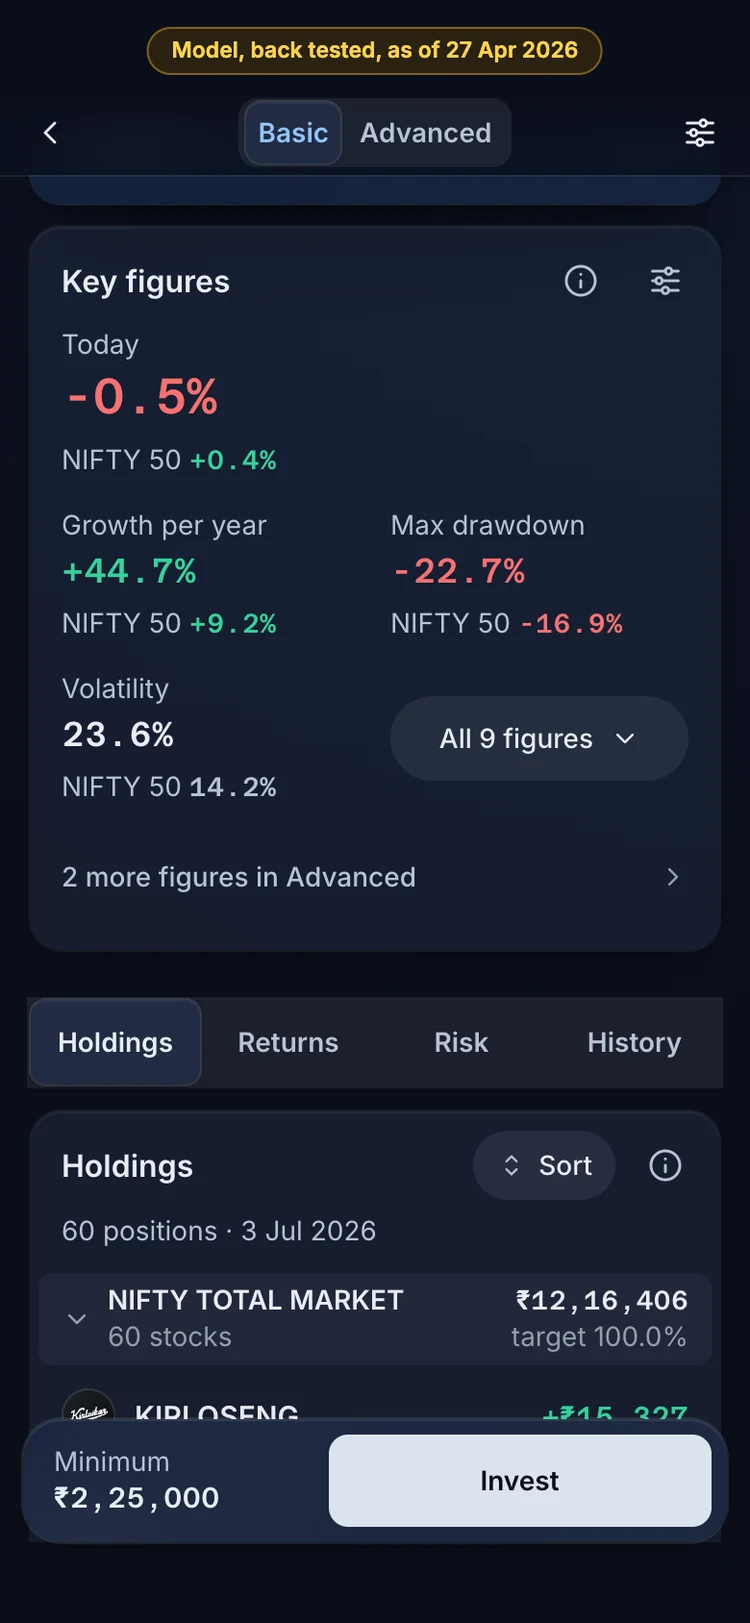
4Key figures: today, growth per year and max drawdown, each beside the NIFTY 50. 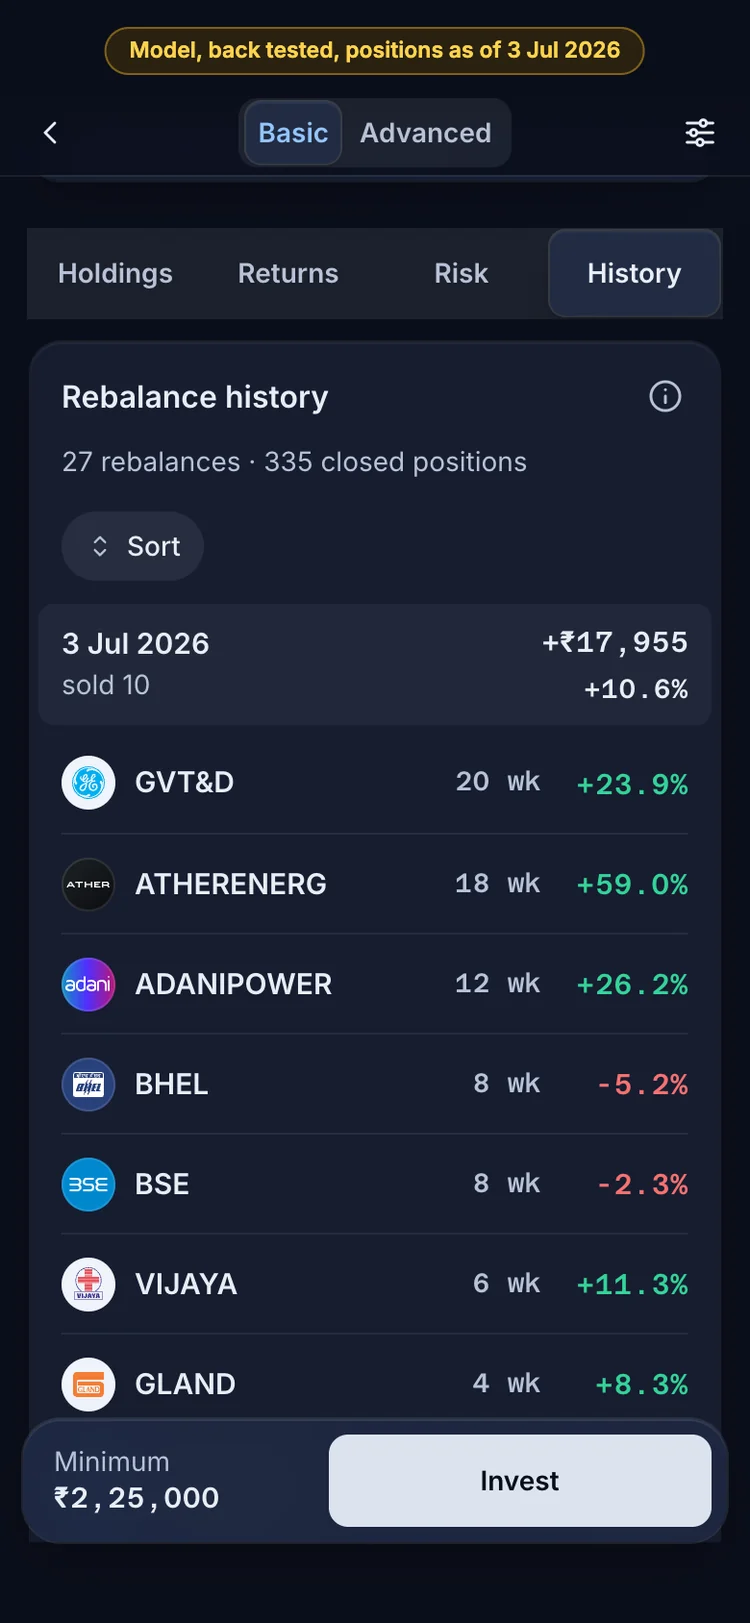
5The History tab: every rebalance in the model record, with the stocks sold and how each did.
Screens from the RupeeCase app, shown with Allcap. Model, back tested. As of 27 Apr 2026. Watch the walkthrough
03Documents
Everything behind the sheet.
- Allcap strategy page
- Rebalance history135 rebalances
- Rebalance history, CSV
- Allcap as plain text
- Full equity core tier
- Disclaimers
Compare Allcap with
Other factsheets
- higher CAGRDynamic Asset AllocatorCAGR 45.2%
- lower CAGRMidcap SmallcapCAGR 42.6%
- All marketAllcap Multi Asset
- All marketTotalMarket Hybrid
CAGR on the cards: Model, back tested. As of 27 Apr 2026.
04Questions
The Allcap factsheet,
in plain words.
What does the Allcap factsheet show?
The model, back tested record of Allcap: a CAGR of 44.70%, a deepest fall of −22.72% and a Sharpe ratio of 1.68 as of 27 Apr 2026, with 50 holdings rebalanced every 2 weeks. Every figure is after estimated charges and names its date.
What does it cost to run Allcap?
0.2% of traded value per rebalance, nothing else: no subscription, no AUM fee, no performance fee and no lock in. About 2.2% of capital a year at 0.2% of traded value, from the published rebalance record: 27 rebalances in the year to 3 Jul 2026, about 11.1 times the portfolio traded (sales and purchases). Weight resets and broker side charges (brokerage, STT, exchange charges, GST) are not included. Turnover varies year to year. On the minimum capital of ₹2,25,000 that is about ₹5,000 a year, an estimate from the model record, not a promise.
How much capital does Allcap need?
About ₹2,25,000, enough to hold one share of every name at recent prices, as of 8 Aug 2026. More capital tracks the model weights more closely.
Are these actual returns?
No. RupeeCase is a technology platform, not a fund, a PMS or a SEBI registered investment adviser. Model figures are back tested, after estimated charges, and are not actual client returns or a promise of future returns; capital can be lost.
Explore next
Read the record behind the factsheet.
- Free module 3.1The Momentum Factor11 min read
- CalculatorSTP calculatorFree, with the formula and a worked example
- Blog noteAllcap: the number everyone quotes and nobody picksStrategy notes, a short note
- SectorCapital Goods stocksNSE sector across the 18 index algos
- Free module 2.4How Backtesting Works8 min read
Allcap.
Read the rules, then decide.
About ₹2.25L to start. 0.2% of traded value per rebalance, no lock in.