



Three gaps between the index and your account
When you buy an index ETF you expect the index return. Three separate gaps stand in the way:
- Index to NAV
- NAV to market price
- Market price to you
Read one more paragraph and a list, 120 words
- Index to NAV. The fund's portfolio, after its expenses, cash and dividend timing, does not match the index exactly. This is what tracking error and tracking difference measure.
- NAV to market price. Units trade on the exchange at whatever buyers and sellers agree. The price can sit above the NAV (a premium) or below it (a discount).
- Market price to you. The spread between the best buy and sell quotes, and the impact of your own order on a thin book.
SEBI's rules address the first gap directly and the second through market makers and disclosure. The third is yours to manage. The module on how ETFs work covers the mechanics of creation and redemption that tie the gaps together.
What SEBI requires
The circular on development of passive funds (23 May 2022) sets the rules most investors meet:
- Tracking error
- Tracking difference
- iNAV
- Market makers
- Direct dealing with the AMC
SEBI's cap on yearly tracking error for equity and gold ETFs
SEBI circular, 23 May 2022
daily NAV gap to the Nifty 50, annualised, for most Nifty 50 ETFs
AMFI NAVs and NSE, year to 12 Oct 2026
median daily trading in Nifty BeES, the busiest Nifty 50 ETF
NSE bhavcopies, year to 12 Oct 2026
the premium over NAV at which Bandhan Nifty 50 ETF closed on 12 Dec 2025
NSE close, AMFI NAV
Read a list, 148 words
- Tracking error is defined as "the annualized standard deviation of the difference in daily returns" between the index and the NAV, over the past year. For ETFs and index funds other than debt it shall not exceed 2%, except in force majeure, and it is disclosed every day on the AMC and AMFI websites.
- Tracking difference, the annualised return gap, is disclosed monthly for 1, 3, 5 and 10 years and since allotment.
- iNAV, the live value of the portfolio per unit, is shown on the exchange through the day: within 15 seconds for equity ETFs; for gold and international ETFs it may be static when the underlying market is shut.
- Market makers: each AMC appoints at least two exchange members to provide continuous quotes.
- Direct dealing with the AMC is for orders above ₹25 crore (from 1 May 2023); everyone else buys and sells on the exchange.
Gap one: the NAVs track almost identically
I took the daily NAVs of 16 Nifty 50 ETFs from AMFI for 13 Oct 2025 to 12 Oct 2026 and compared each day's change with the Nifty 50 price index. The annualised standard deviation of the gap was 0.26% for most and 0.20% to 0.28% for all whose NAV series had no unit split in the year.
Read 2 more paragraphs, 117 words
Part of that is dividends: the price index drops when a constituent goes ex dividend, while the fund keeps the cash.
Over the full year, the NAV of Nifty BeES fell 10.41% while the Nifty 50 price index fell 11.35%. The fund's NAV beat the price index because it kept the dividends; against the Nifty 50 total return index, which counts dividends, it would trail by about its expenses. That return gap is the tracking difference, and for a plain Nifty 50 ETF it is mostly the expense ratio. The note TRI vs price index explains which Nifty a fund should be measured against, and the tracking error calculator computes both figures from your own return series.
Gap two: the price you trade at
Here the 16 funds parted ways.
| ETF (NSE symbol) | Median daily trading | Median gap to NAV | Days more than 0.5% from NAV | Largest premium |
|---|---|---|---|---|
| Nippon India Nifty 50 BeES (NIFTYBEES) | ₹188.5 crore | 0.11% | 1.6% | 0.72% |
| ICICI Prudential Nifty 50 ETF (NIFTYIETF) | ₹20.8 crore | 0.11% | 1.6% | 0.68% |
| SBI Nifty 50 ETF (SETFNIF50) | ₹20.7 crore | 0.11% | 1.6% | 0.99% |
| Kotak Nifty 50 ETF (NIFTY1) | ₹4.9 crore | 0.15% | 0.4% | 0.49% |
| HDFC Nifty 50 ETF (HDFCNIFTY) | ₹3.7 crore | 0.12% | 1.2% | 0.50% |
| Aditya Birla SL Nifty 50 ETF (BSLNIFTY) | ₹1.6 crore | 0.12% | 3.3% | 1.50% |
| Motilal Oswal Nifty 50 ETF (MOM50) | ₹12 lakh | 0.15% | 6.9% | 1.44% |
| Tata Nifty 50 ETF (NETF) | ₹8 lakh | 0.17% | 6.5% | 1.51% |
| Bandhan Nifty 50 ETF (IDFNIFTYET) | ₹3 lakh | 0.17% | 11.8% | 18.67% |
| LIC MF Nifty 50 ETF (LICNETFN50) | ₹2 lakh | 0.22% | 4.9% | 0.74% |
- Nifty BeES188.48
- ICICI Pru Nifty 50 ETF20.78
- SBI Nifty 50 ETF20.72
- Kotak Nifty 50 ETF4.90
- ABSL Nifty 50 ETF1.58
- Bandhan Nifty 50 ETF0.03
Median daily traded value on NSE, 13 Oct 2025 to 12 Oct 2026, from the daily bhavcopies.
Read one more paragraph, 88 words
The busy funds closed within about 0.1% of NAV on a typical day and rarely more than 0.5% away. The thin ones were usually close too, which is the trap: a typical day says little about the day you need to trade. On 11 to 16 Dec 2025, Bandhan's Nifty 50 ETF closed 13% to 19% above its NAV, with as little as ₹19 lakh changing hands; anyone who bought then paid for a basket of Nifty 50 shares at nearly a fifth more than it was worth.
When the underlying market is shut: gold and international ETFs
Premiums and discounts are larger when the NAV cannot follow the price in real time. Gold BeES, the most traded gold ETF, closed 6.26% above its NAV on 21 Jan 2026 and 9.97% below it on 1 Feb 2026, a Sunday Budget session, when its NAV still carried Friday's gold price. Both gaps closed within days. The gold guide shows the rest of that record.
The MON100 price stayed within about 2% of its NAV from mid 2021 to Nov 2024, then sat 13% to 22% above it at several month ends in 2025 and 2026, including 12.96% on 12 Oct 2026.
MON100 NSE month end close divided by its AMFI NAV for the same day, minus 1. Jun 2021 (after the 1 to 10 unit split of 17 Jun 2021) to 12 Oct 2026.
Read 2 more paragraphs, 79 words
International ETFs can drift much further. When new units cannot be created freely, for example when a fund house pauses fresh subscriptions, buyers bid the price above the value of the holdings and nothing pulls it back.
On 12 Oct 2026 MON100 closed at ₹324.21 against a NAV of ₹287.02: a buyer paid 12.96% more than the shares underneath were worth. If that premium shrinks to zero, the investor loses it even if the Nasdaq 100 does not move.
Gap three: spread and impact
The bhavcopy shows closing prices, not quotes, but the trade counts say a lot. Nifty BeES had a median of about 49,000 trades a day; LIC MF's Nifty 50 ETF had 32. In a thin book a market order can sweep several price levels. The module on the real cost of trading explains impact cost, which is the same for an ETF as for a share.
How to buy an ETF without paying for the gaps
- Pick the busy fund on the index you want
- Compare the price with the iNAV
- Use a limit order
- Be careful at odd hours
- For international ETFs, check the premium first
MythThe ETF with the lowest expense ratio is always the cheapest to own.
FactA 0.05% lower expense ratio is lost in one trade at a 0.5% premium. For most holders, liquidity and the price against NAV matter as much as the fee.
Read one more paragraph and a list, 192 words
- Pick the busy fund on the index you want. Trading volume, not the expense ratio alone, decides what you pay on the way in and out. A fund that trades crores a day usually trades close to NAV.
- Compare the price with the iNAV shown on the exchange or the AMC's site before you place the order. More than a few tenths of a percent apart on an equity ETF is a warning.
- Use a limit order near the iNAV rather than a market order, especially in a thin fund.
- Be careful at odd hours. At the open, close, special sessions, and when the underlying market is shut (gold on a weekend session, US shares during Indian hours), the iNAV may be stale and gaps widen.
- For international ETFs, check the premium first. When it is large, a fund of funds on the same index, which deals at NAV, avoids it.
The direct indexing guide covers the other way to hold an index: owning the shares yourself, with no NAV and no premium, but with every rebalance taxed in your hands. The note ETF vs index fund compares the two fund routes.
How this shows up in RupeeCase
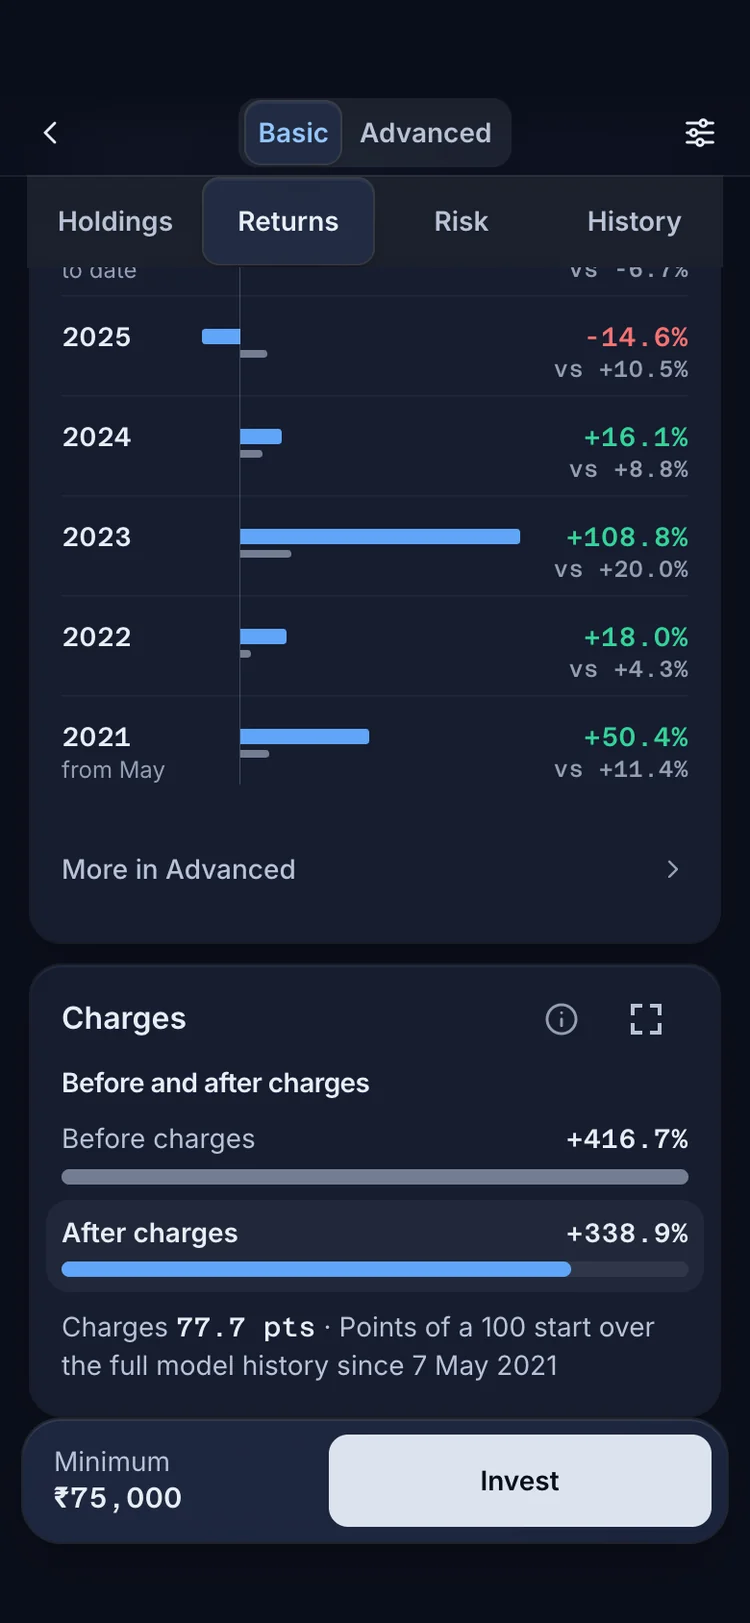
1Model returns are shown after estimated charges: brokerage, STT, exchange fees and GST. 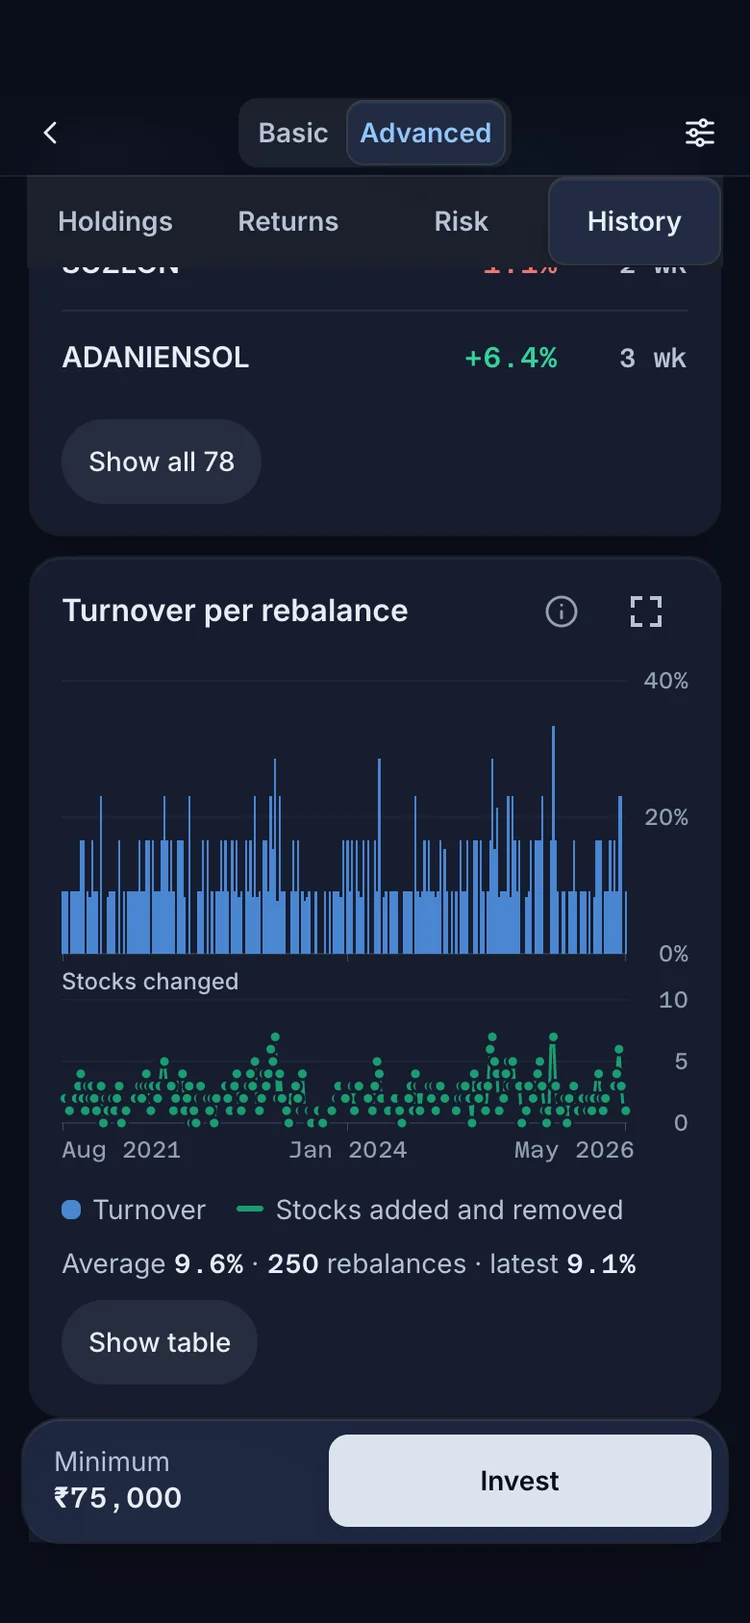
2Turnover per rebalance, from the model record: the fee is charged only on what trades. 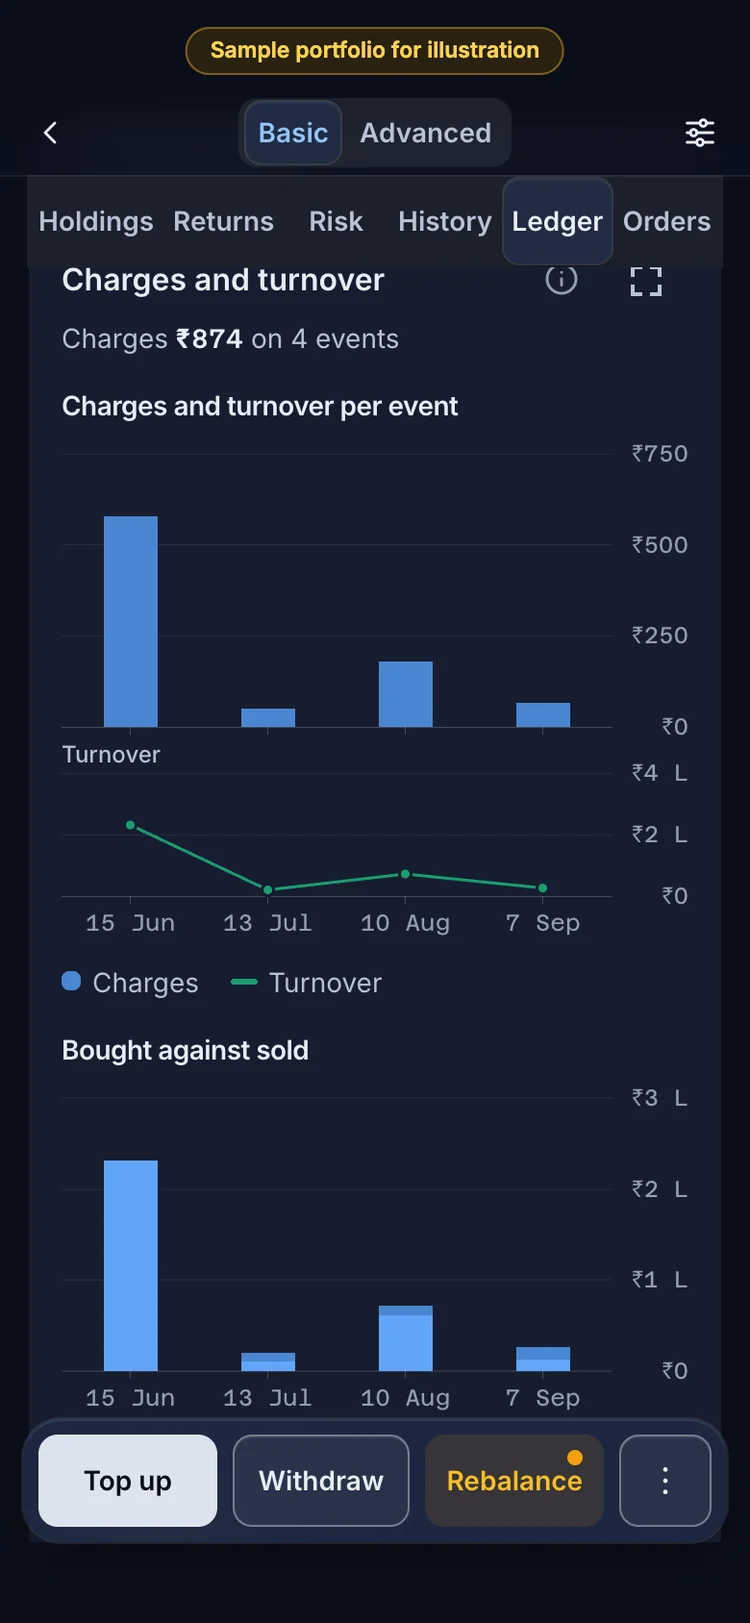
3Your own charges and turnover, event by event, on the Ledger tab. 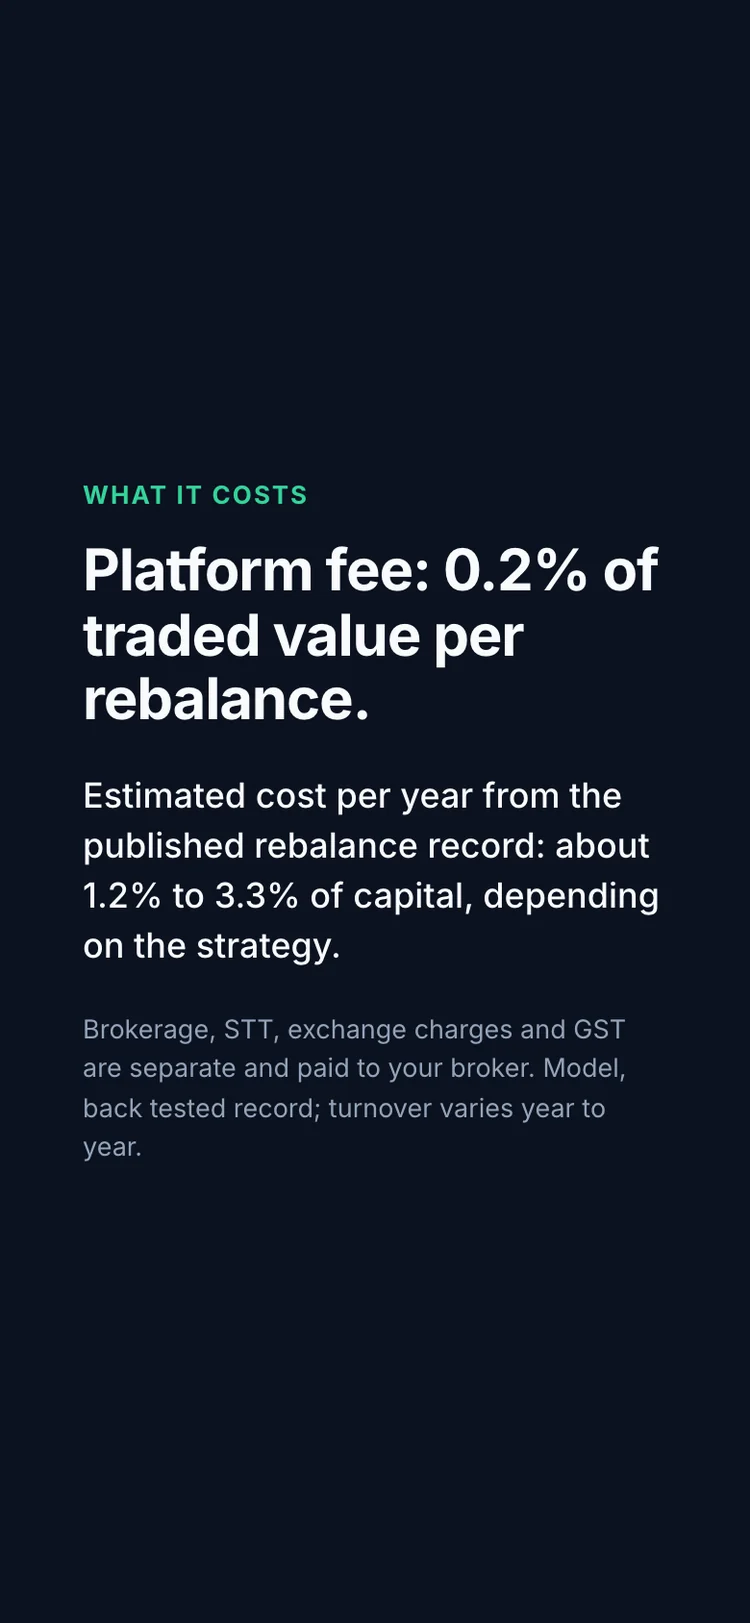
4Platform fee: 0.2% of traded value per rebalance. About 1.2% to 3.3% of capital a year in the published record, depending on the strategy.
Where it sits in RupeeCase, in words
A RupeeCase rule holds the shares themselves in your own demat, so there is no NAV, premium or discount between you and the holdings; your costs are the spread and impact on each stock at each rebalance, plus the fee. Nifty 50 Equal Weight holds 50 stocks in equal amounts, rebalanced every 4 weeks: model CAGR 16.35%, deepest fall −15.71%, as of 27 Apr 2026.
Questions investors ask
What is tracking error in an ETF?
The annualised standard deviation of the daily difference between the ETF's NAV return and its index return, over the past year. SEBI caps it at 2% for equity and gold ETFs and index funds, except in force majeure.
What is the difference between tracking error and tracking difference?
Tracking error measures how much the daily gap varies. Tracking difference is the gap in return over a period, mostly the expense ratio. A fund can have low tracking error and still trail its index every year by its fee.
Why does an ETF trade above or below its NAV?
The price is set by buyers and sellers on the exchange. Market makers keep it near the NAV by creating or redeeming units; when they cannot, or the underlying market is shut, the price can drift. In the year to 12 Oct 2026, thin Nifty 50 ETFs closed more than 0.5% from NAV on up to 12% of days.
What is iNAV?
The indicative NAV: the live value of an ETF's holdings per unit, shown on the exchange during trading hours. For equity ETFs SEBI requires it within 15 seconds of the underlying market.
Which Nifty 50 ETF is the most liquid?
In the year to 12 Oct 2026, Nippon India Nifty 50 BeES traded a median of about ₹188 crore a day on NSE, far more than any other Nifty 50 ETF. Liquidity changes; check current volumes before you buy.
Can I buy ETF units directly from the AMC?
Only for orders above ₹25 crore, under SEBI's 2022 passive funds circular. Smaller investors buy and sell on the exchange.