Where it is
ScreenStrategy and DashboardBasic
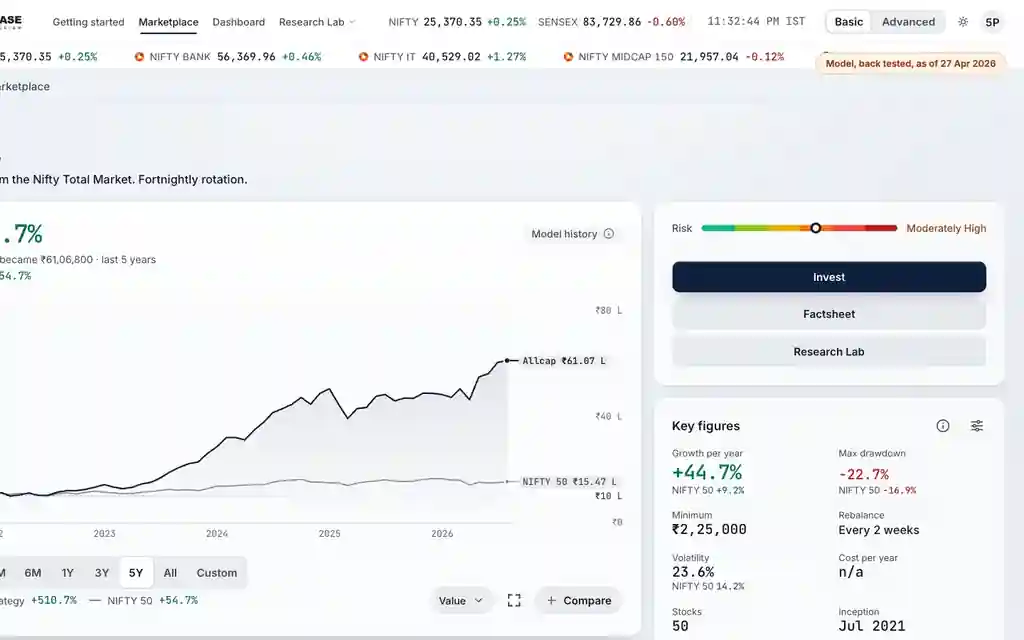
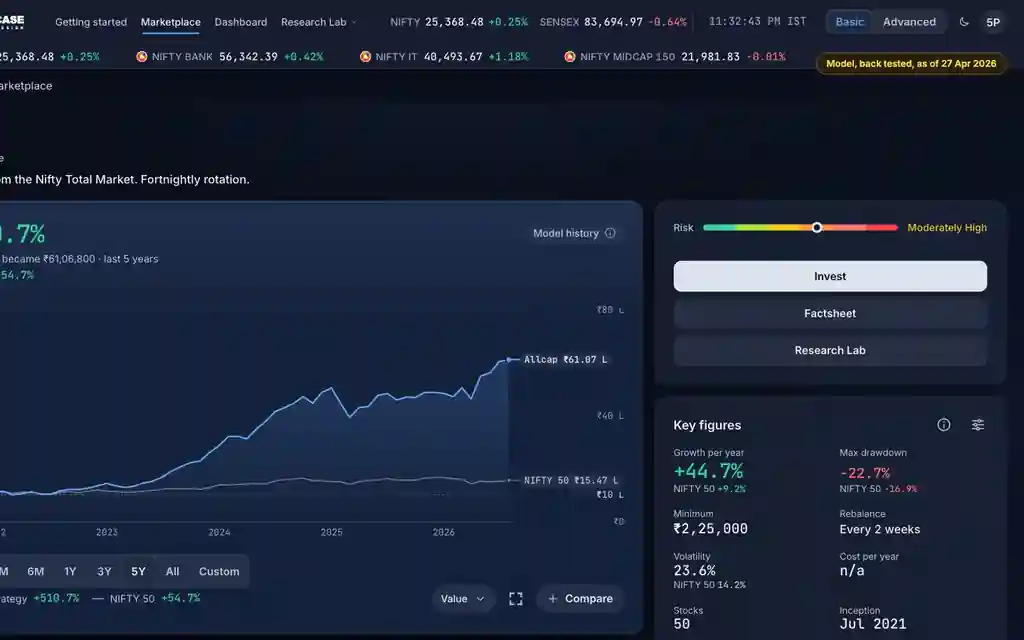
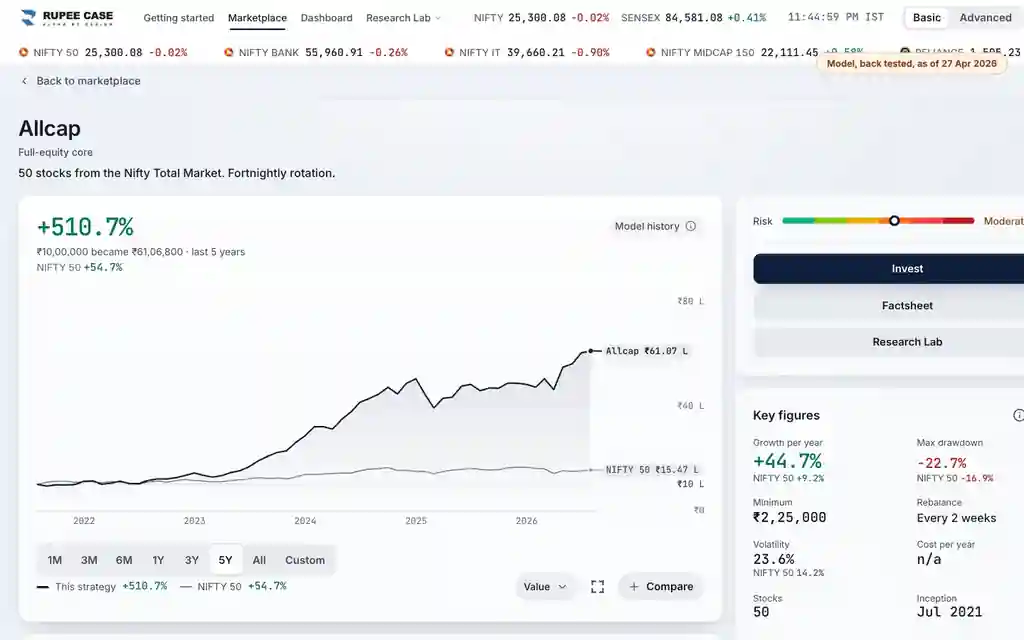
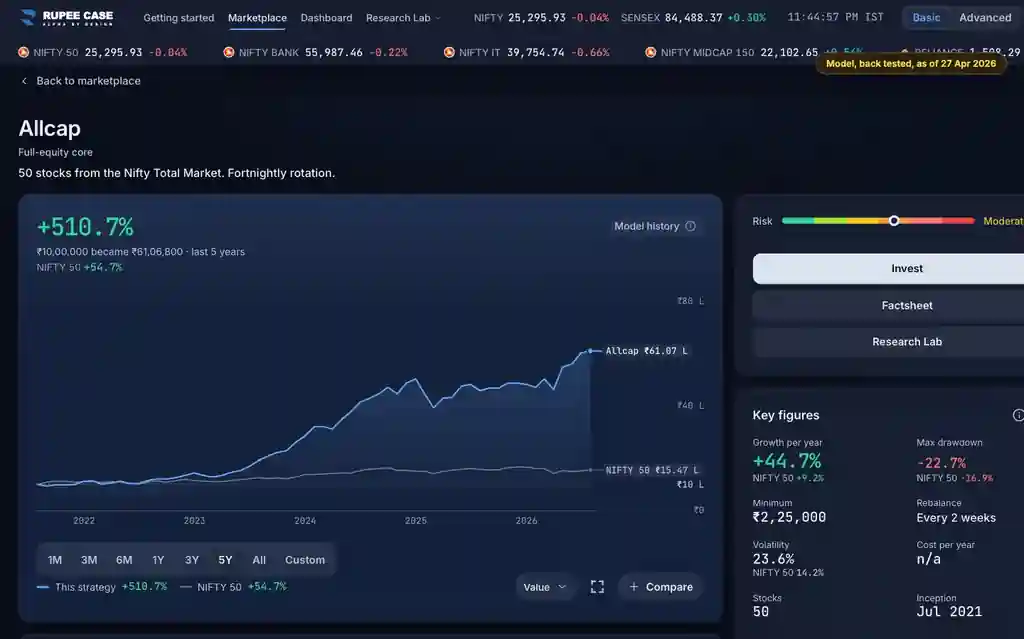
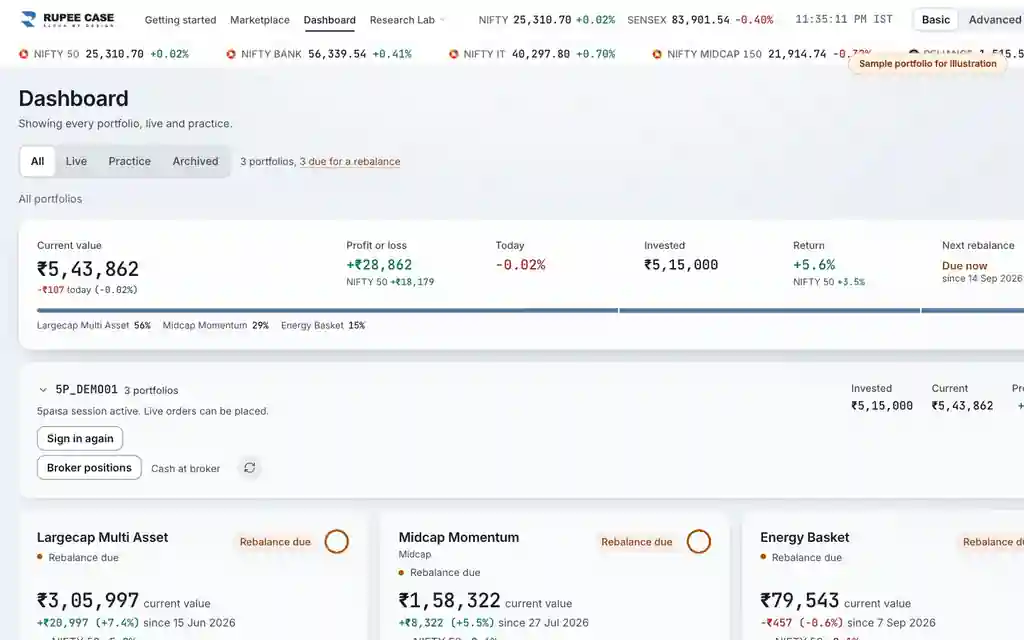
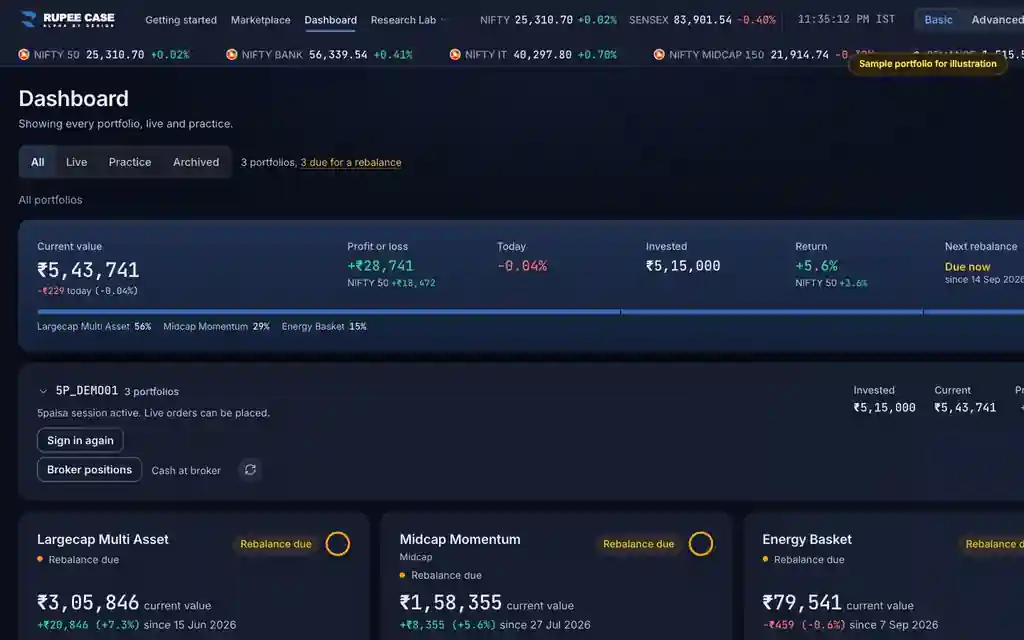
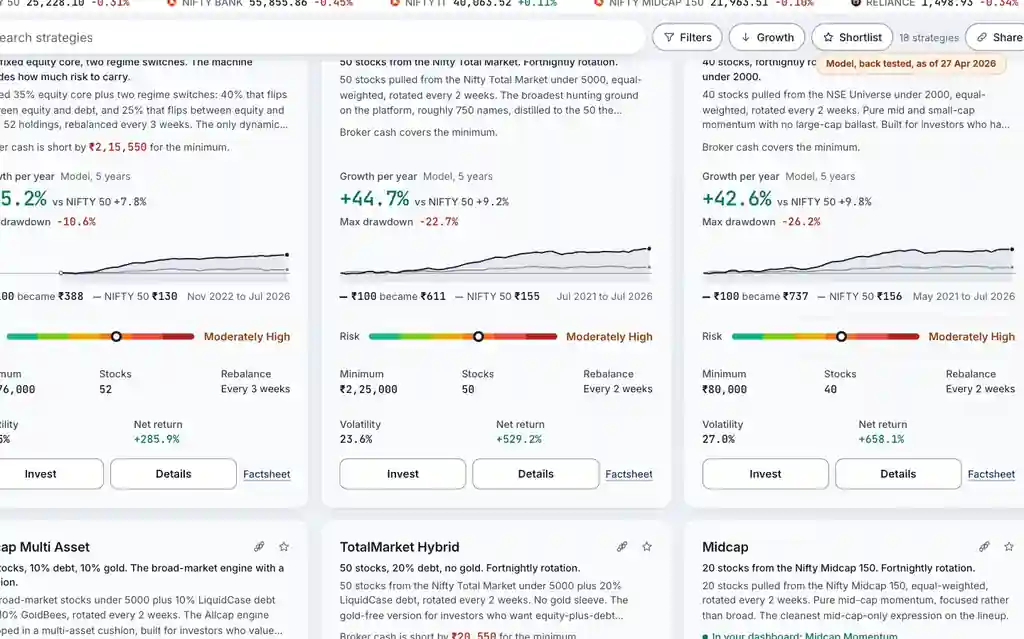
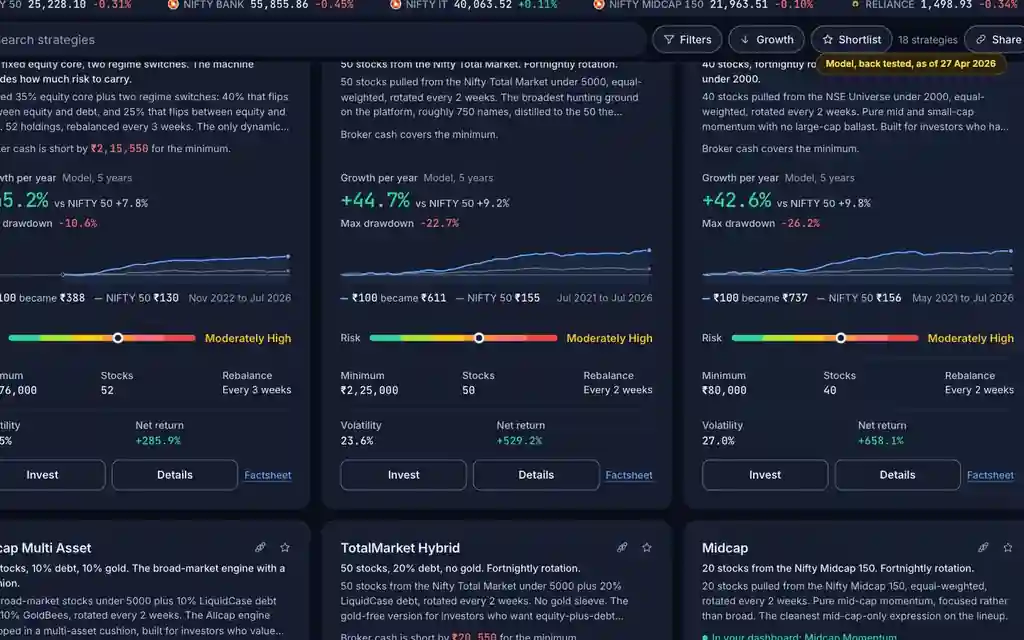
The "Model history" tag sits on every strategy page hero; your own portfolios are on the Dashboard. Both in Basic and Advanced.
What it means
Every figure on the Marketplace and on a strategy page is model history: a back test of the strategy's rules, after estimated charges and before taxes on your gains. Your portfolio on the Dashboard is different: it is the live value of what you hold at your broker, counted from the day you invested. On a portfolio, the Returns and Risk cards (apart from Contribution) show the linked strategy's model since you invested, and say so in a band.
The formula
Model history: what Rs 10,00,000 put in at the start of the chosen window would have grown to, after estimated charges. Your portfolio: your holdings at the live price plus cash, less estimated costs.
Strategy hero = model value at the window end, with the start set to 100, minus 100 (after estimated charges)
Portfolio current value = holdings x live price + cash - estimated costs
Worked example
Example only
- Model: Rs 10,00,000 became Rs 18,00,000 over the window, +80%
- You: Rs 2,00,000 invested 3 months ago is worth Rs 2,06,000, +3%
- Both can be true: one is a back test, one is your money
How to read it
- Look for the "Model history" tag before reading a strategy figure.
- On a portfolio, the hero and key figures are yours, live, since you invested.
- A band saying "not your portfolio" marks the model cards on a portfolio page.
Watch out
- Model history is a back test: past performance does not promise future returns.
- Portfolio Returns and Risk tabs mostly show the model since you invested, beside your live figures.
- Your own returns include your timing, top ups and withdrawals; the model has none of those.
Transcript
The video has no sound. These are its on screen captions, chapter by chapter.
- 0:00Where it is. Every strategy page opens on its model history.
- 0:17What it means. Your own portfolio is on the Dashboard: its live value since you invested.
- 0:34Worked example. Worked example, example only: Model: Rs 10,00,000 became Rs 18,00,000 over the window, +80%. You: Rs 2,00,000 invested 3 months ago is worth Rs 2,06,000, +3%. Both can be true: one is a back test, one is your money.
- 0:40How to read it. On a portfolio, these Returns cards are the model since you invested.
- 0:58Watch out. Watch out: Model history is a back test: past performance does not promise future returns. Portfolio Returns and Risk tabs mostly show the model since you invested, beside your live figures. Your own returns include your timing, top ups and withdrawals; the model has none of those.
Terms in this tutorial
- backtestSimulation of a strategy on historical data to estimate past performance.
- equity curveChart of portfolio value over time.
- transaction costAll costs of trading including brokerage, STT, exchange charges, GST, and slippage.