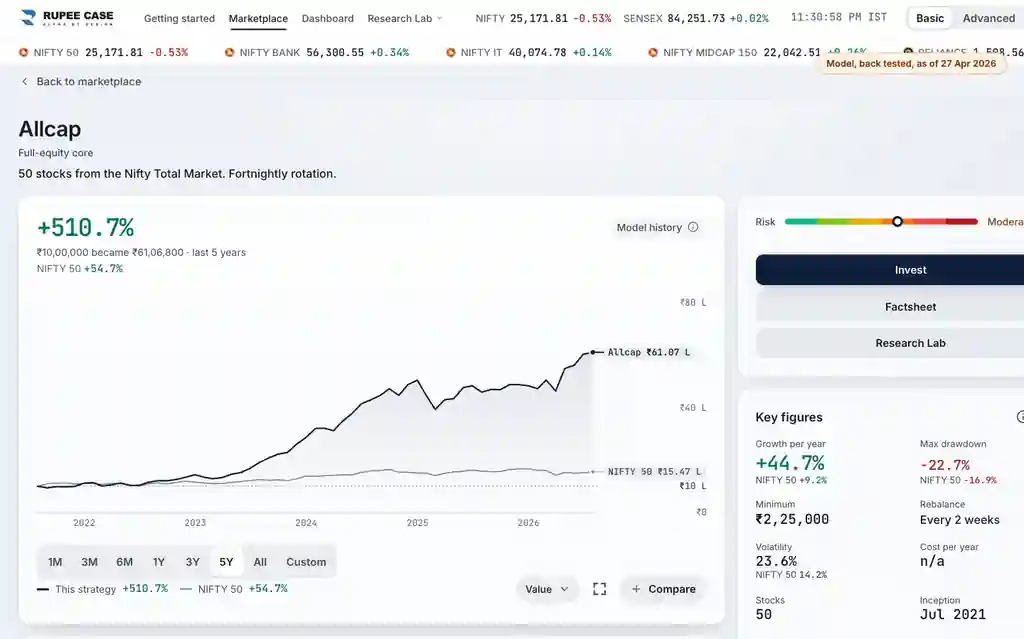
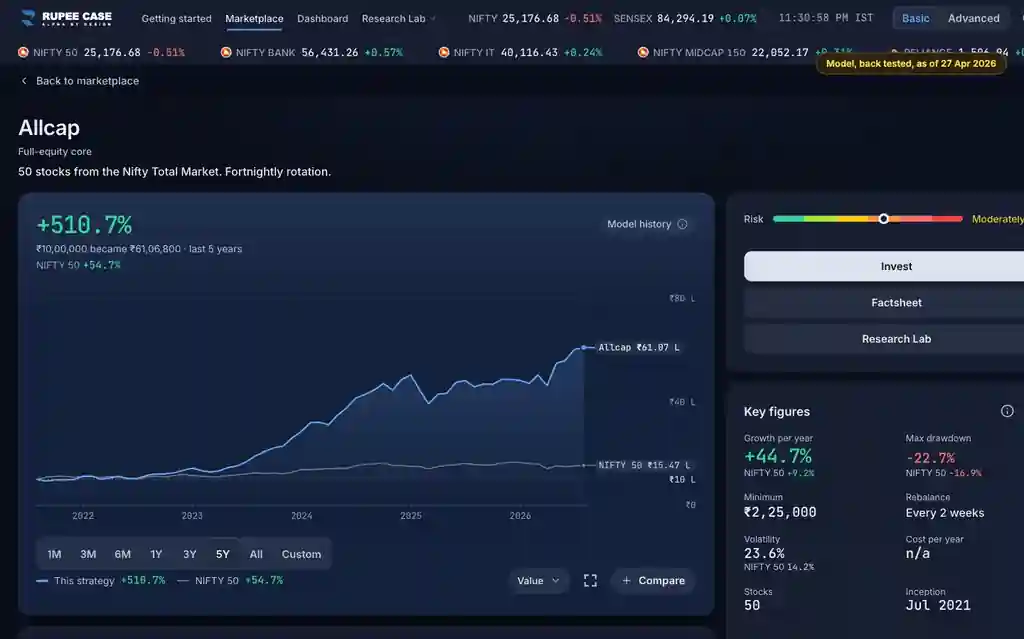
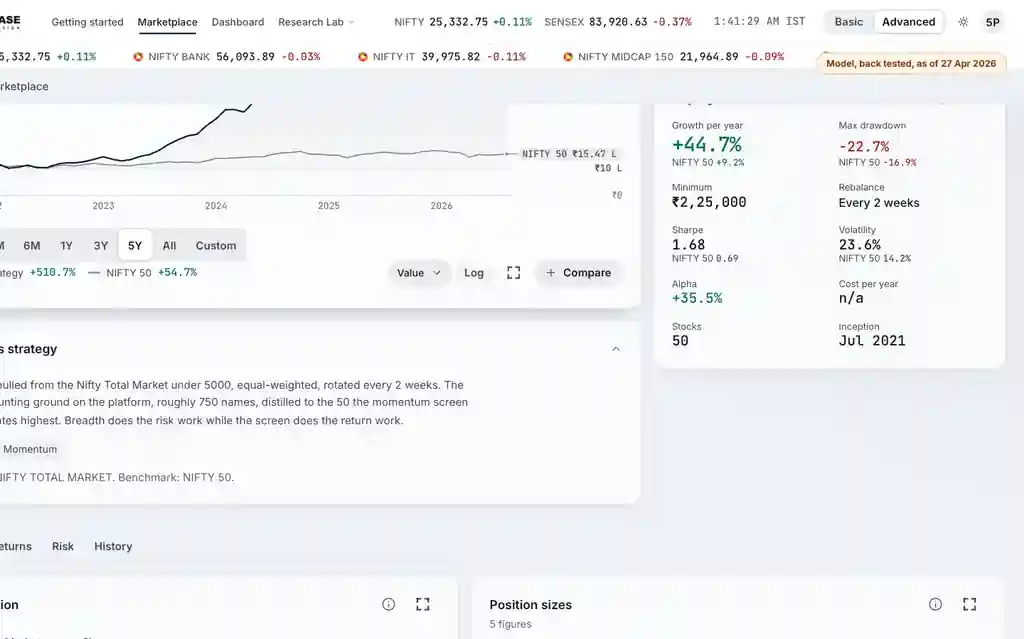
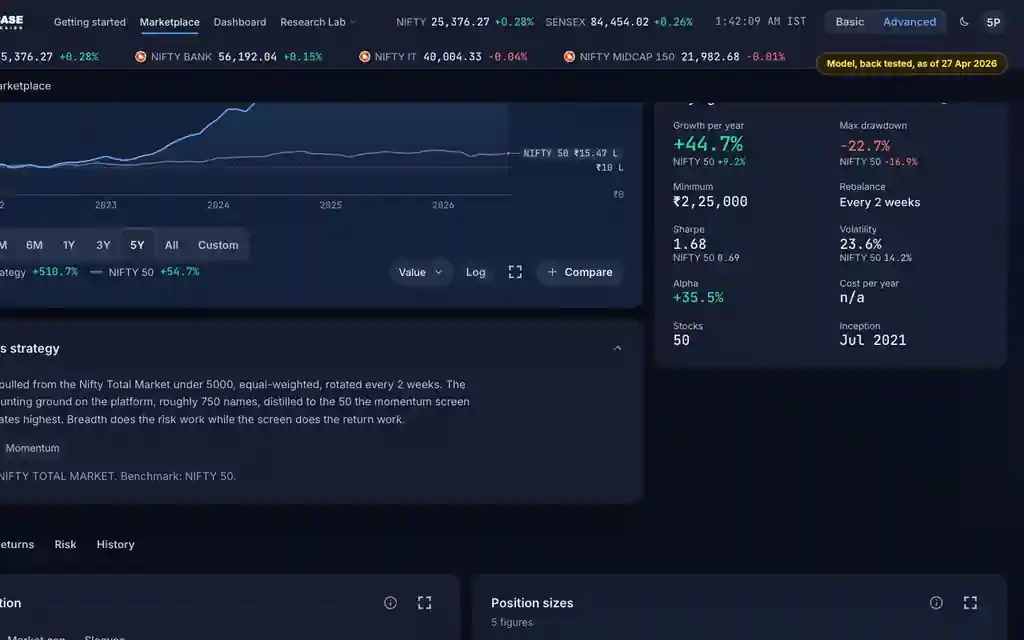
Where it is
ScreenStrategy, Risk tabAdvanced
The Risk tab of a strategy page, in Advanced: the Risk figures card and the Market link card. Any of them can be pinned to Basic from its info button.
What it means
These figures describe the shape of the ride. Sortino is return per unit of downside only. Calmar is growth per year per point of the deepest fall. VaR 95 is the loss that only 5 percent of weeks went past; CVaR 95 is the average of those worst weeks. Beta is how much the strategy moved with the benchmark; tracking error is how far apart the two wandered; information ratio is the yearly gap per unit of that wander. Up and down capture compare the strategy with the benchmark in the benchmark's up weeks and down weeks.
The formula
All are worked out from weekly returns over the chosen period, against the primary benchmark, with 52 weeks to a year. Sortino uses a target of 0, while Sharpe uses 6 percent.
Sortino = average weekly return x 52 / downside deviation (losses below 0 only, a year basis)
Calmar = growth per year / size of the max drawdown
VaR 95 = 5th percentile weekly return, shown as a loss; CVaR 95 = average of the weeks at or below it
Beta = covariance with the benchmark / benchmark variance
Tracking error = standard deviation of (strategy - benchmark weekly return) x square root of 52
Information ratio = average weekly gap x 52 / tracking error
Up capture = strategy / benchmark geometric average weekly return in the benchmark's up weeks (down capture: down weeks)
Worked example
Example only
- Calmar: 30% a year, max drawdown -20%: 30 / 20 = 1.5
- Information ratio: 0.2% a week ahead x 52 = 10.4%; tracking error 13%: 0.8
- Up capture: +1.2% against +1.0% a week in up weeks: 120%
How to read it
- A VaR 95 of 5%: about 1 week in 20 lost more than 5%.
- Down capture under 100%: it fell less than the benchmark in the benchmark's down weeks, on average.
- Beta 1.2: when the benchmark moved 1% in a week, the strategy moved about 1.2% on average.
Watch out
- Sortino uses a target of 0 and Sharpe uses 6%, so the two do not line up.
- The app reads weekly history; this recording's model history is month ends, so its cards say "Monthly".
- These describe the past model; they do not predict the next fall.
Transcript
The video has no sound. These are its on screen captions, chapter by chapter.
- 0:00Where it is. In Advanced, the Risk tab lists every risk figure.
- 0:06What it means. VaR 95: the loss only 5 percent of periods went past.
- 0:36Worked example. Worked example, example only: Calmar: 30% a year, max drawdown -20%: 30 / 20 = 1.5. Information ratio: 0.2% a week ahead x 52 = 10.4%; tracking error 13%: 0.8. Up capture: +1.2% against +1.0% a week in up weeks: 120%.
- 0:42How to read it. Beta: how much it moved with the benchmark.
- 1:11Watch out. Watch out: Sortino uses a target of 0 and Sharpe uses 6%, so the two do not line up. The app reads weekly history; this recording's model history is month ends, so its cards say "Monthly". These describe the past model; they do not predict the next fall.
Terms in this tutorial
- Sortino ratioLike Sharpe but only penalises downside volatility.
- betaSensitivity of a portfolio to the market.
- tracking errorDifference between a portfolio return and its benchmark return.
- volatilityHow much returns fluctuate.