



Tuesday 16 Jun 2026 and Monday 2 Feb 2026. India VIX closed at 13.36 on the first and 13.87 on the second, two similar readings. A weekly Nifty expiry followed each. After 16 Jun the index finished the week 159 points under the forward, and an iron condor kept Rs 3,962 while a long straddle lost Rs 9,740. After 2 Feb the index ran 846 points above it, the same kind of condor lost Rs 7,514 and the long straddle made Rs 26,920. Similar VIX, similar shapes, opposite weeks. A strategy suits a view, and a view has three parts. This lesson names them and shows what each one costs. Every price is an NSE end of day settlement, dated, so nothing is live and nothing says where Nifty goes.
3By the end you can
- Turn a view on direction, volatility and time into a short list of option payoffs.
- Say which shapes are long and which are short volatility, and why the sign matters.
- Explain why a low or high India VIX does not decide the strategy.
The idea, plainly
Ask three questions, in order. Where does the index end? What does implied volatility do? Over how long? The first fixes the shape of the payoff. The second fixes whether the position gains or loses when option prices swell, which is its vega. The third picks the expiry, weekly or monthly, and so how fast time decay and gamma work. A match between a view and a payoff means only that the structure lines up with the view. It says nothing about whether the view is right.
Three questions give a short list, and the numbers decide what is left
Question one: where does the index end?
Four answers cover almost everything: up, down, inside a range, or a big move either way. Each lines up with a few shapes. The strategy finder in the tool below holds fifteen templates and prices each from a dated chain.
| The view | Payoffs that line up | Volatility exposure |
|---|---|---|
| Index rises | Bought call, bull call spread, bull put spread, sold put | The bought call is long volatility, the credit shapes are short |
| Index falls | Bought put, bear put spread, bear call spread | The bought put is long volatility, the credit spread is short |
| Stays in a range | Sold straddle, sold strangle, iron condor, iron fly, call butterfly, call calendar | Short volatility, apart from the calendar, which is long |
| Moves a lot, either way | Bought straddle, bought strangle | Long volatility |
Read 2 more paragraphs, 151 words
Each answer has a price. A bought option or spread needs the index to travel further than the premium paid, so its breakeven sits a premium's distance from the strike. A sold option or spread collects that premium and gives it back beyond the breakeven. A shape that caps its loss, like a condor, names the worst day in advance. A shape that does not, like a sold straddle or a sold put, leaves it open. The finder tags each template defined risk or open risk for that reason.
Several of these have their own lessons. Module F26 covers the debit spreads, module I19 the credit spreads, module I18 the straddles and strangles, and module I20, I21 and I22 the range shapes. One case sits outside the map. Protecting a holding you already own follows what you hold and not a market view, and module I26 treats it as insurance.
Question two: what does implied volatility do?
Implied volatility is the market's price for uncertainty. A bought option gains when it rises. A sold option gains when it falls. Vega measures that in rupees for one volatility point. Options are already priced from implied volatility, so a volatility view has value only where it differs from what the price says. The two grids show the same weekly chain, three days on, for an iron condor and a bought straddle. Read across the unmoved row and the signs run opposite.
With the index unmoved, the condor gains when volatility falls and loses when it rises
| Move in the future | 3 days after the example date, rupees | ||
|---|---|---|---|
| IV −3 | IV same | IV +3 | |
| −2% | −4,147 | −3,741 | −3,564 |
| −1% | +525 | −224 | −932 |
| 0% | +2,698 | +1,429 | +247 |
| +1% | +986 | +94 | −717 |
| +2% | −3,545 | −3,276 | −3,207 |
Green is profit and red is loss; deeper colour means a larger amount. The outlined cell is the starting point.
2 terms this section turns on
With the index unmoved, the straddle gains when volatility rises and loses when it falls
| Move in the future | 3 days after the example date, rupees | ||
|---|---|---|---|
| IV −3 | IV same | IV +3 | |
| −2% | +11,239 | +11,941 | +13,292 |
| −1% | −2,461 | −4 | +2,933 |
| 0% | −9,049 | −5,151 | −1,250 |
| +1% | −3,896 | −1,105 | +2,084 |
| +2% | +9,189 | +10,132 | +11,767 |
Green is profit and red is loss; deeper colour means a larger amount. The outlined cell is the starting point.
Question three: over how long?
Nifty weekly options expire on the nearest Tuesday and the monthly on the last Tuesday of the month. On 16 Jun 2026 the weekly straddle cost 1.36% of the forward and covered 7 days. The monthly straddle cost 1.89% and covered 14 days. A shorter expiry asks for a smaller move, sooner, and rewards being right quickly. Time decay and gamma both run faster near expiry, so being late costs more. A longer expiry gives the view room and costs more premium. The ATM strike on a weekly is the one nearest the parity forward, since weeklies have no future of their own, and on a monthly it is the one nearest the future.
What does the finder show for each shape?
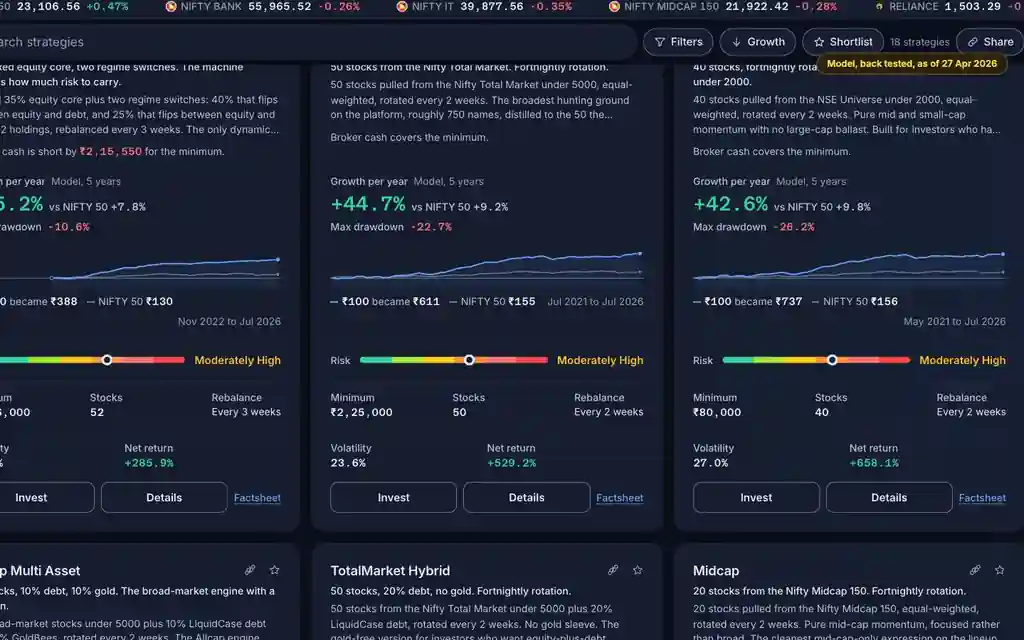
Each card carries the premium paid or received for one lot, the maximum gain and maximum loss at expiry, the breakevens, theta for one day and vega for one volatility point. It tags the shape as defined or open risk, and as long, short or little volatility exposure. Read the worst loss first. Then set the breakevens against the move the straddle prices, and only then look at theta and vega. Every number is a dated settlement price, so the cards are a worked example and not a quote.
Does a low or high VIX settle it?
This is the question behind many searches. VIX is the expected volatility over the next 30 days, annualised, taken from Nifty option prices. It tells you how dear options are. It does not tell you the direction, and it does not tell you whether the move will arrive. On 2 Feb and 16 Jun it sat a little above its median, at 13.87 and 13.36 against a median of 12.16 across 300 sessions. Fifty six days after the first of those, on 30 Mar, it closed at 27.89, the highest reading in the file.
VIX has a wide range, and a reading near the middle of it says little about the next week
Worked example: two weeks, one VIX
Both weekly expiries fall on a Tuesday, 23 Jun and 10 Feb, and are settled on the index close for expiries before 7 Dec 2026. The lot is 65 units. The shapes use the finder's strikes. The condor sells six steps out and buys ten. The fly sits at the strike nearest the parity forward with wings six steps away. The straddle uses that strike and the strangle four steps either side. All prices are settlement prices, not fills.
| One lot | Entered 16 Jun | Entered 2 Feb |
|---|---|---|
| India VIX that day | 13.36 | 13.87 |
| Expiry close | 23,824.10 | 25,935.15 |
| Forward on entry | 23,983.33 | 25,089.19 |
| Straddle's one standard deviation, points | 408 | 528 |
| Iron condor | Rs 3,962 | −Rs 7,514 |
| Iron fly | Rs 2,311 | −Rs 4,790 |
| Bought straddle | −Rs 9,740 | Rs 26,920 |
| Bought strangle | −Rs 10,826 | Rs 24,700 |
Read 2 more paragraphs, 144 words
The 16 Jun week was quiet. The straddle priced a one standard deviation move of 408 points and the index moved 159, under half of that. The sold shapes paid: the condor kept its full credit and the fly made Rs 2,311. The bought shapes bled: the straddle lost Rs 9,740 of the Rs 21,174 it cost, and the strangle lost all of its premium.
The 2 Feb week was not. The straddle priced 528 points and the index ran 846, well past it. The condor and the fly both lost their maximum, Rs 7,514 and Rs 4,790. The straddle made Rs 26,920 and the strangle Rs 24,700. Nothing in the VIX of 13.36 against 13.87 told the two weeks apart. Two weeks picked after the fact prove no rule. They show each shape doing what its payoff says.
The common mistake
The belief: India VIX is low, so a quiet market suits selling, and when it is high the market is about to fall.
VIX is a price, and a price is not a forecast. In the table the two weeks opened with nearly the same VIX and ended in opposite places. The highest reading came on 30 Mar, fifty six days after a reading of 13.87. Whatever a view rests on, it rests on more than the VIX screen. A shape with a defined risk names its worst case before any order is placed, and that is all it names. The finder lists shapes that line up with a view. It does not say the view is right, and a match is not a call.
Two terms to hold on to from 17.10
Key takeaways
- A view has three parts: direction, volatility and time.
- Direction sets the payoff shape. Volatility sets the sign of vega.
- A weekly asks a smaller move, sooner. A monthly gives the view room.
- Two weeks with nearly the same VIX ended in opposite places.
- A match between a view and a payoff does not make the view right.
- To protect holdings, the hedge follows what you hold, not a market view.
Where this section sits in module 17.10
Before you trade. Derivatives trading carries a high risk of loss. SEBI's study "Profitability of Individual Traders in the Equity Derivatives Segment (FY25 to FY26)" (August 2026) found that 87.7% of individual traders in equity F&O made net losses in FY26, with aggregate net losses of Rs 91,685 crore. Read the SEBI study