Where it is
ScreenPortfolioBasic
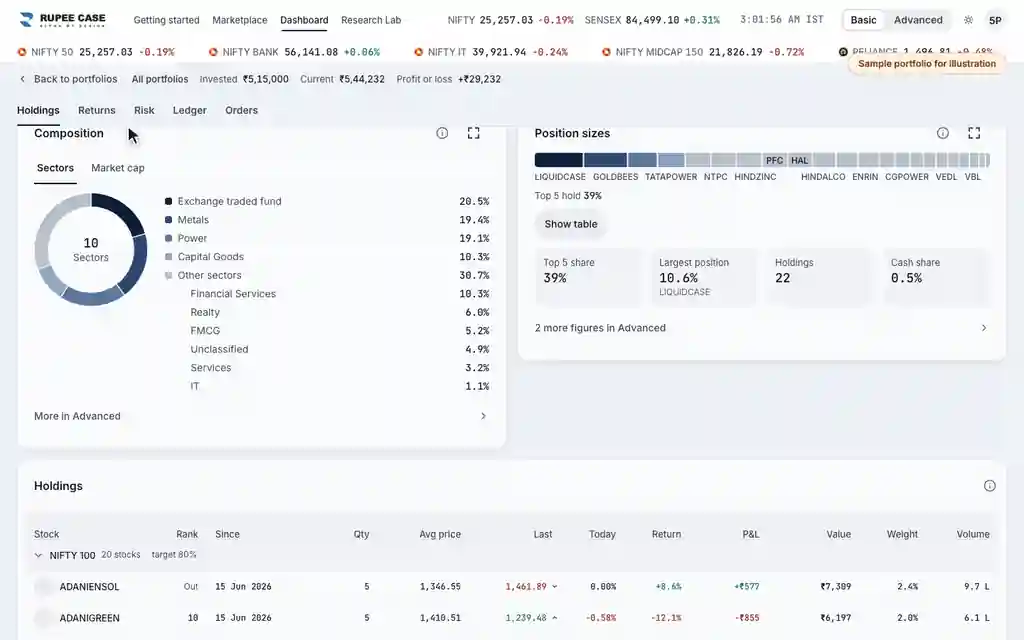
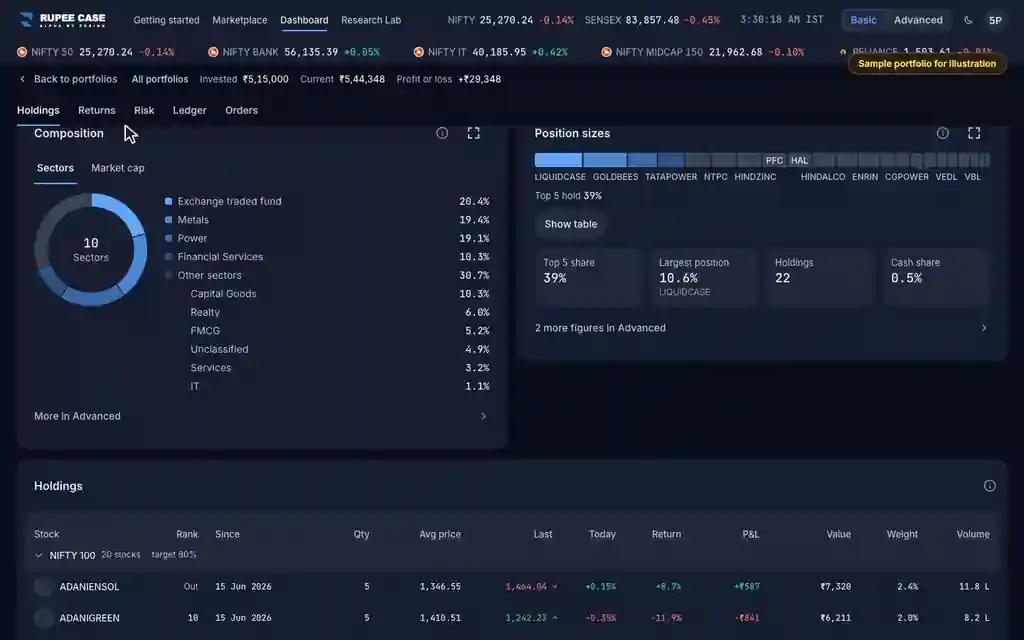
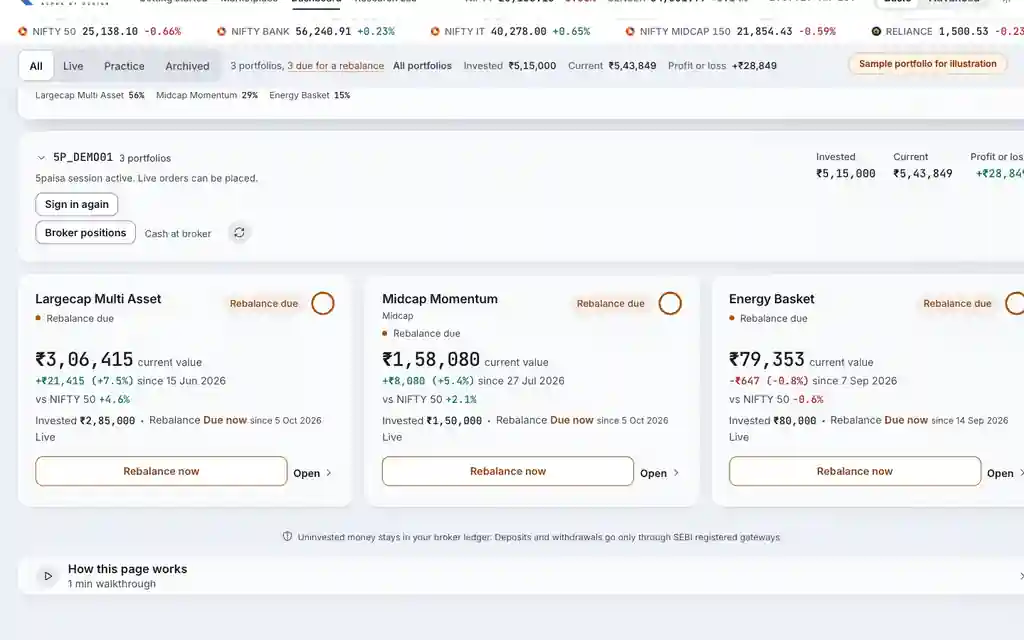
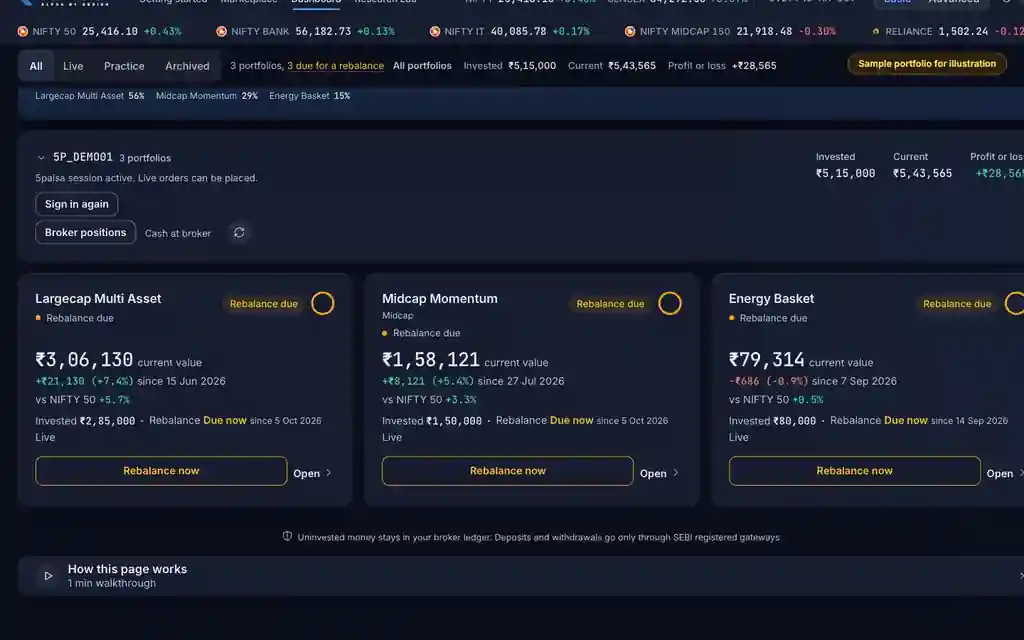
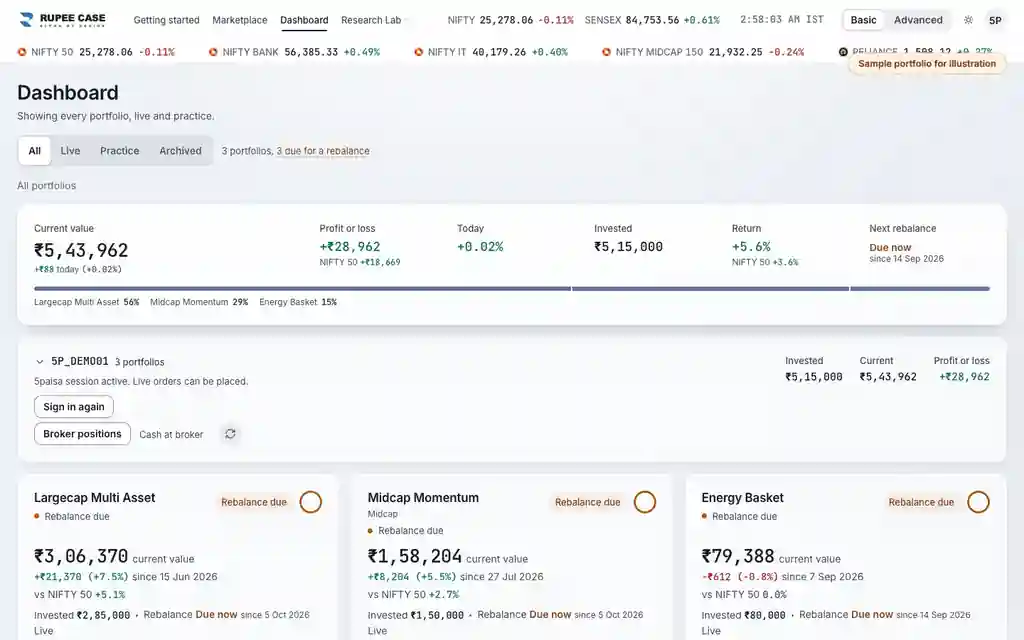
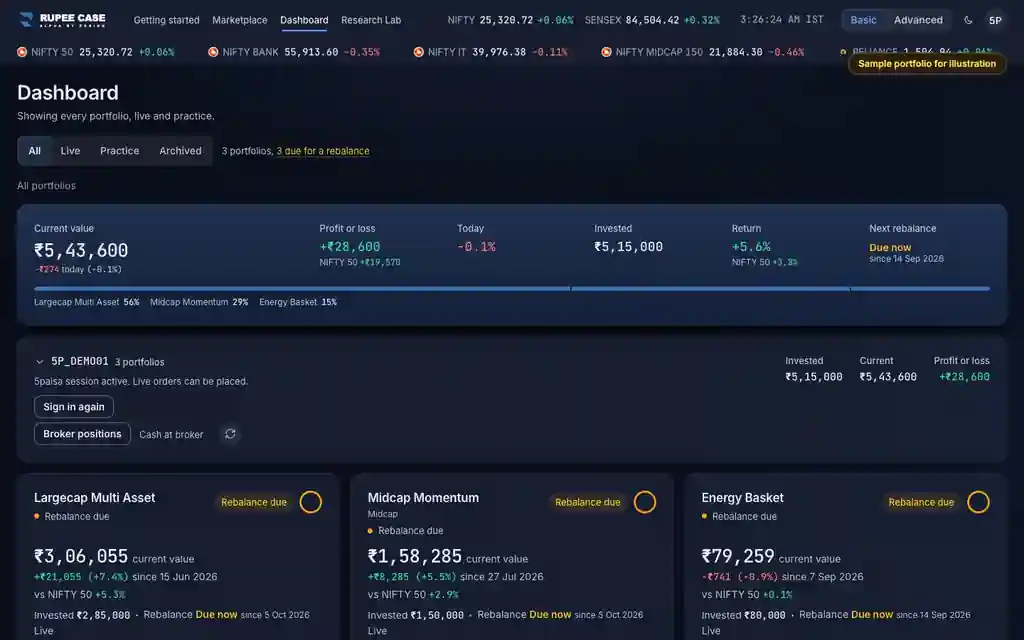
The top of a portfolio page (Dashboard, then Open). Basic and Advanced.
What it means
The large figure is the current value, live. The line under it is profit or loss in rupees and percent on your net invested money, since your first investment. "Same money in NIFTY 50" is what the same amounts, on your own dates, would show in the benchmark. The period chips (Since, 1M, 3M and longer once the portfolio is that old) change only the chart, not these figures.
The formula
The hero figures are live and since you invested. The same money line grows each amount you put in or took out by the benchmark from its own date to today.
Hero = current value, live
Profit or loss = current value - invested (net of withdrawals), since you invested
Same money = each amount in or out, grown by the benchmark from its date to today
Period chips: the chart only
Worked example
Example only
- Rs 1,00,000 in on 1 Jun; NIFTY 50 then 24,000, now 25,200
- Same money in NIFTY 50: Rs 1,05,000, +5%
- Your portfolio at Rs 1,08,000: +8%, 3 points ahead
How to read it
- Read the hero and the same money line together: same amounts, same dates.
- The chart can show 1M or 3M; the hero stays since you invested.
- Values move with live prices during market hours.
Watch out
- The percentage is on net invested money, not per year.
- The benchmark is a price index with no costs; your portfolio carries real charges.
- Changing the chart period does not change the hero figures.
Transcript
The video has no sound. These are its on screen captions, chapter by chapter.
- 0:00Where it is. The large figure is the portfolio's current value, live.
- 0:16What it means. Same money in NIFTY 50: your amounts, on your dates, in the index.
- 0:33Worked example. Worked example, example only: Rs 1,00,000 in on 1 Jun; NIFTY 50 then 24,000, now 25,200. Same money in NIFTY 50: Rs 1,05,000, +5%. Your portfolio at Rs 1,08,000: +8%, 3 points ahead.
- 0:39How to read it. The period chips start on Since. Another chip moves only the chart.
- 0:58Watch out. Watch out: The percentage is on net invested money, not per year. The benchmark is a price index with no costs; your portfolio carries real charges. Changing the chart period does not change the hero figures.
Terms in this tutorial
- Nifty 50Index of 50 large-cap Indian stocks representing about 65 percent of NSE free-float market cap.
- equity curveChart of portfolio value over time.