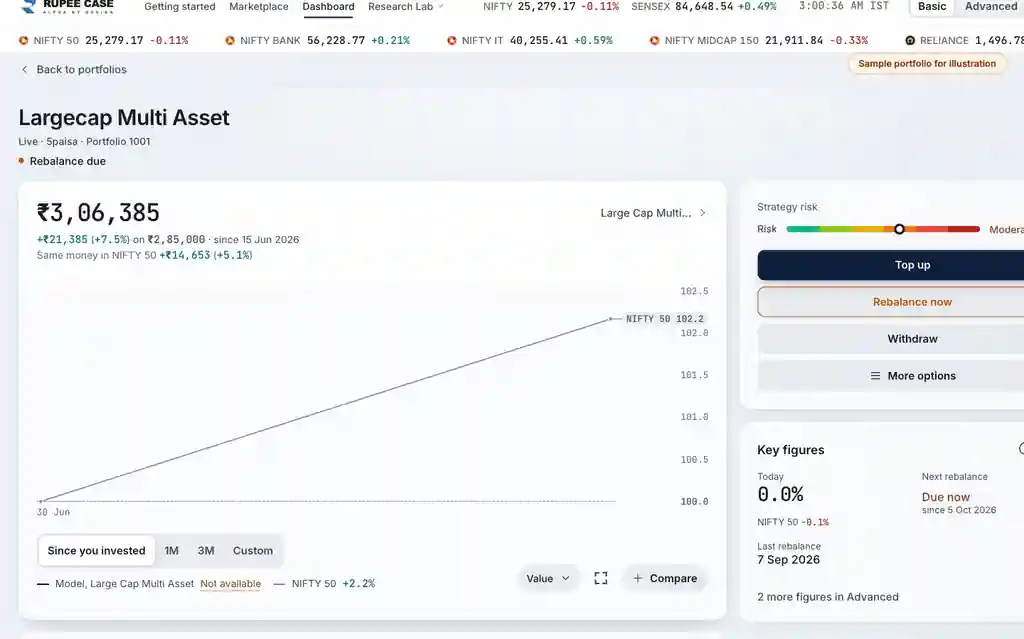
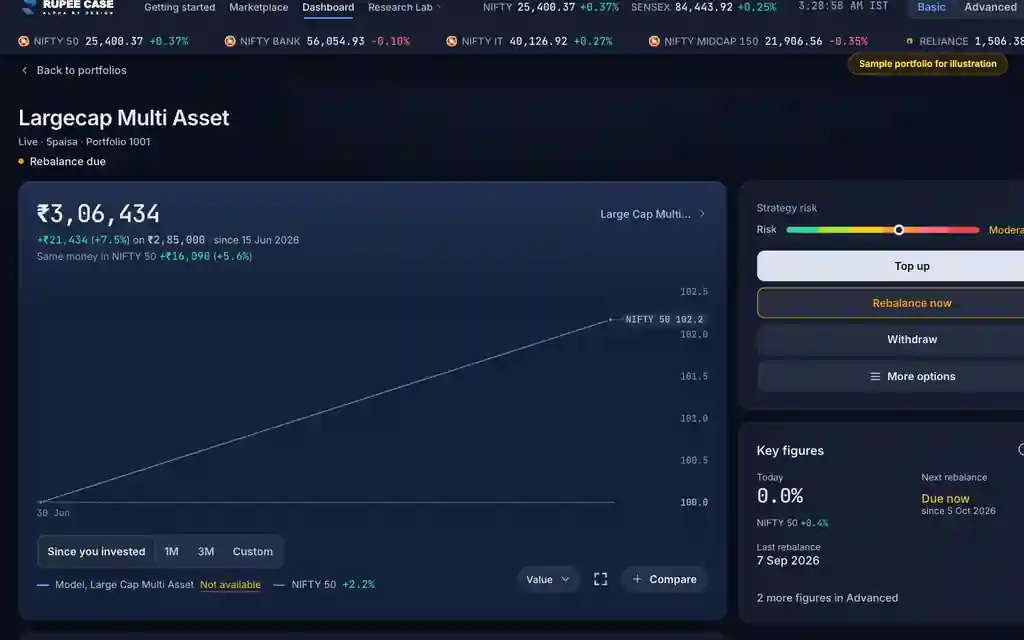
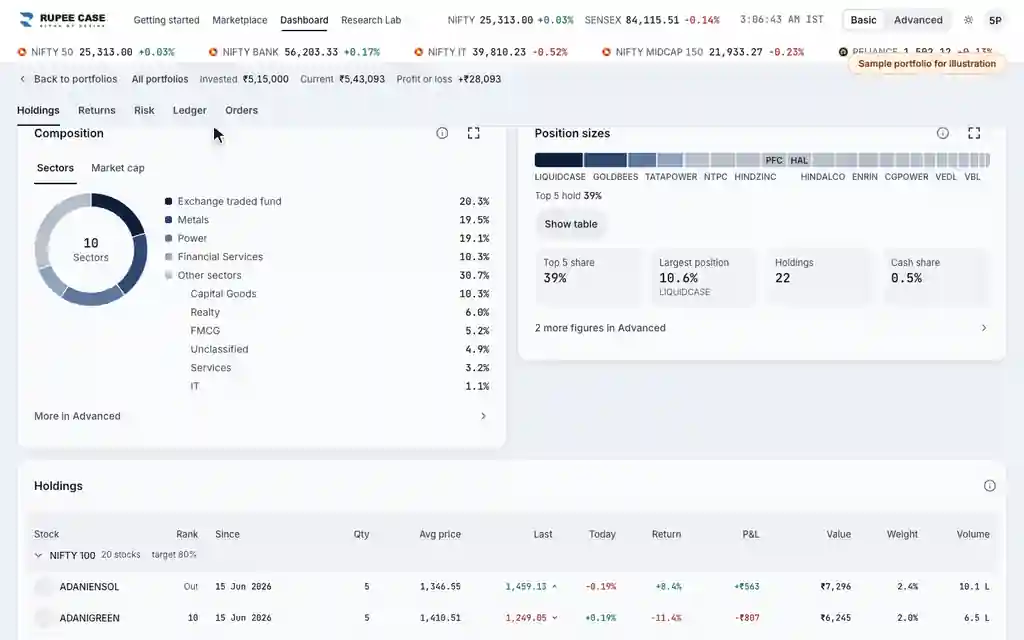
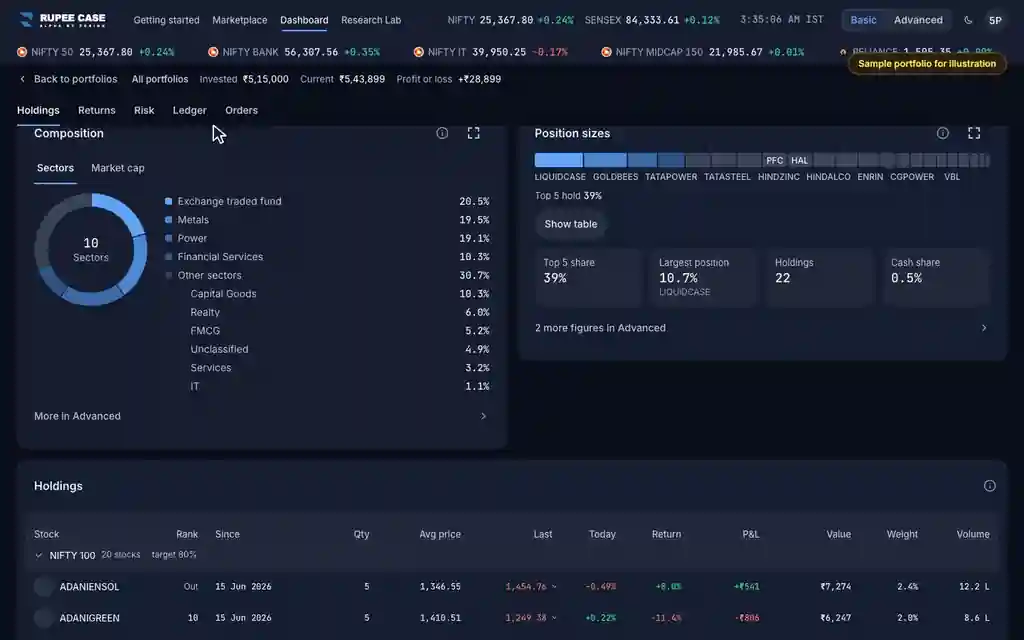
Where it is
ScreenPortfolio, Returns and Risk tabsBasic
The Returns and Risk tabs of a portfolio page, under the band "Model since you invested: <strategy>, not your portfolio". Basic and Advanced.
What it means
A portfolio page mixes two sources. Yours: the hero, the key figures, Holdings, the Compare card's "You, live" bar, Where the return came from (your holdings) and the Ledger. The model: Return figures, Year by year, Drawdowns, Risk figures and the other cards on those tabs show the linked strategy's model since the day you invested, each tagged "Model since you invested".
The formula
Your figures come from your holdings, cash and money in and out. Model cards come from the linked strategy's model history, from the day you invested.
Your figures: live holdings, cash, your money in and out
Model cards: the linked strategy's model history, from the day you invested
Charges: yours on the Ledger; the model's on the strategy page
Worked example
Example only
- You invested on 1 Jun; your portfolio is +6% since
- The model since 1 Jun is +8%: a model card shows +8%
- The 2 points: your dates, top ups, fills and charges
How to read it
- Look for the band and the "Model since you invested" tag.
- Your own return is in the hero; the model's is on the tagged cards.
- Your own charges are on the Ledger tab.
Watch out
- The tab names match a strategy page, but here most cards are the model.
- A model card is not your portfolio: fills, timing and charges differ.
- Just after you invest, model cards may have too little history to fill.
Transcript
The video has no sound. These are its on screen captions, chapter by chapter.
- 0:00Where it is. On a portfolio, the Compare card shows you, live.
- 0:17What it means. Your figures come from your holdings, cash and money in and out. Model cards come from the linked strategy's model history, from the day you invested.
- 0:23Worked example. Worked example, example only: You invested on 1 Jun; your portfolio is +6% since. The model since 1 Jun is +8%: a model card shows +8%. The 2 points: your dates, top ups, fills and charges.
- 0:29How to read it. Your own charges are on the Ledger tab.
- 0:43Watch out. Watch out: The tab names match a strategy page, but here most cards are the model. A model card is not your portfolio: fills, timing and charges differ. Just after you invest, model cards may have too little history to fill.
Terms in this tutorial
- backtestSimulation of a strategy on historical data to estimate past performance.
- slippageDifference between expected trade price and actual execution price.
- transaction costAll costs of trading including brokerage, STT, exchange charges, GST, and slippage.