Where it is
ScreenStrategy, Returns tabBasic
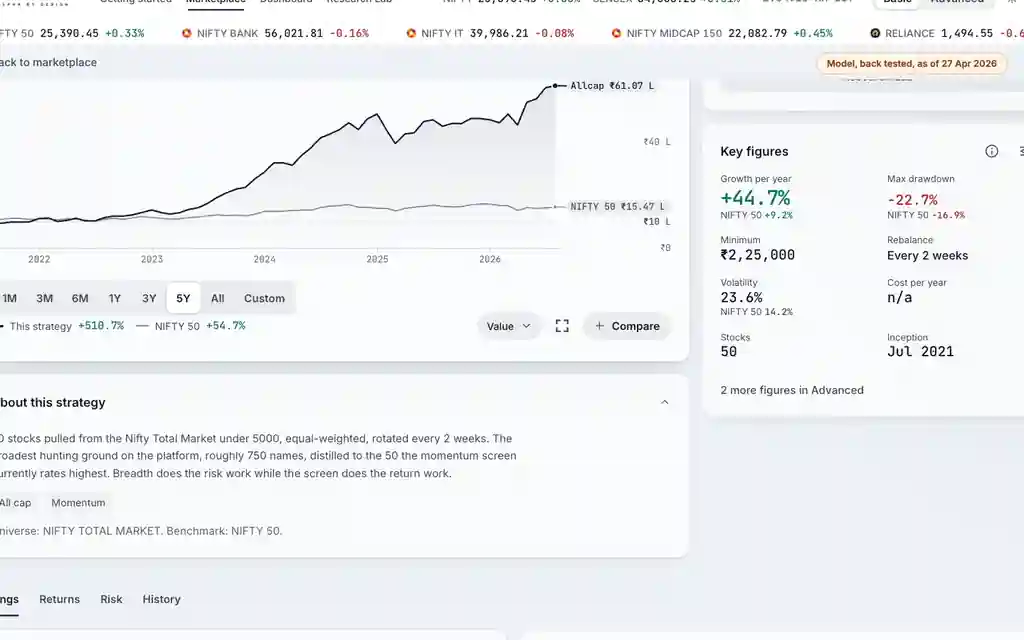
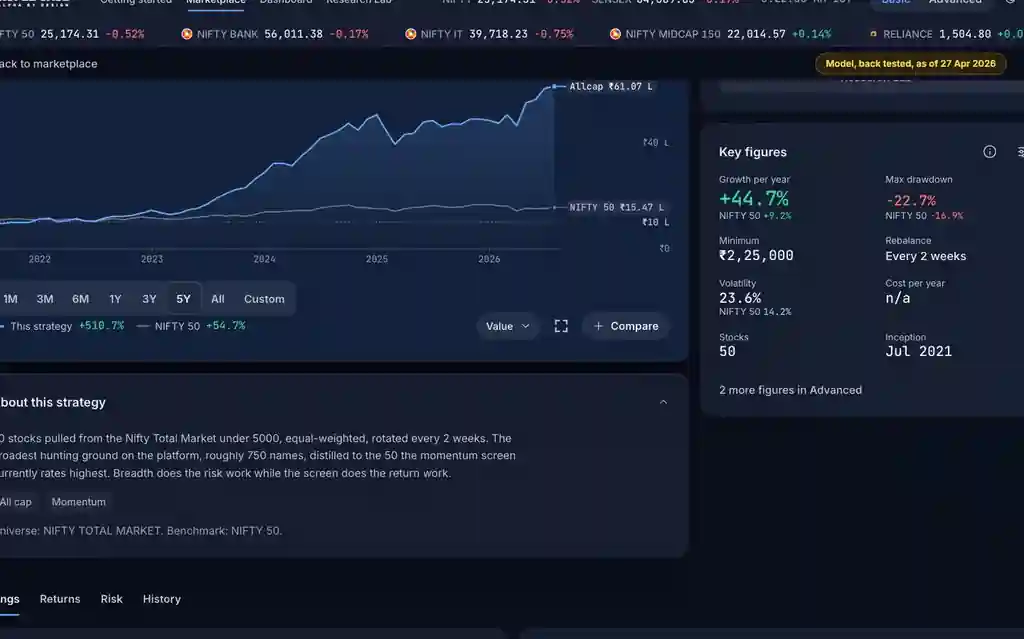
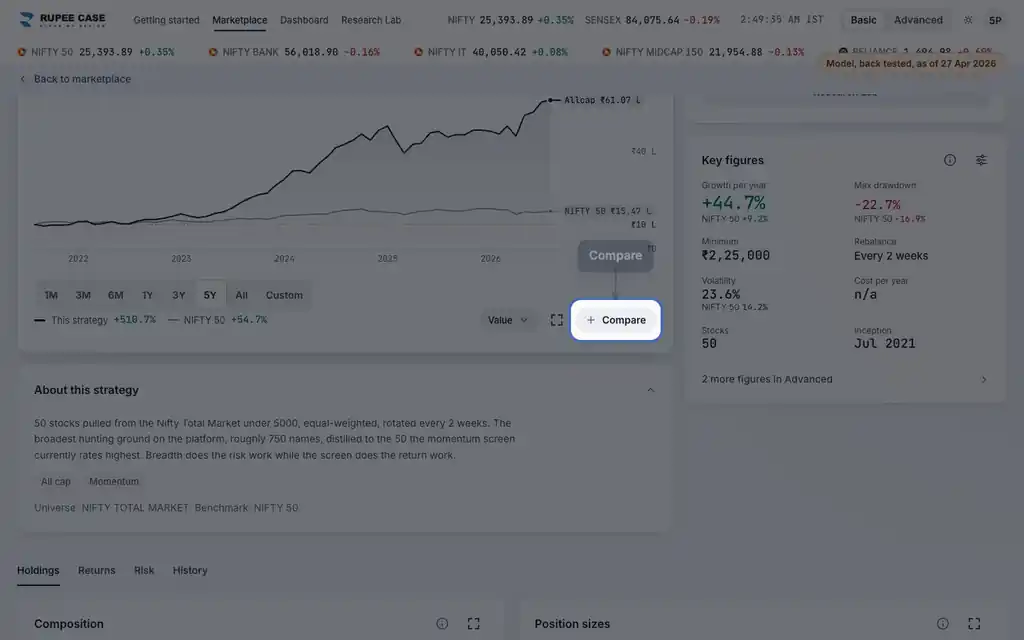
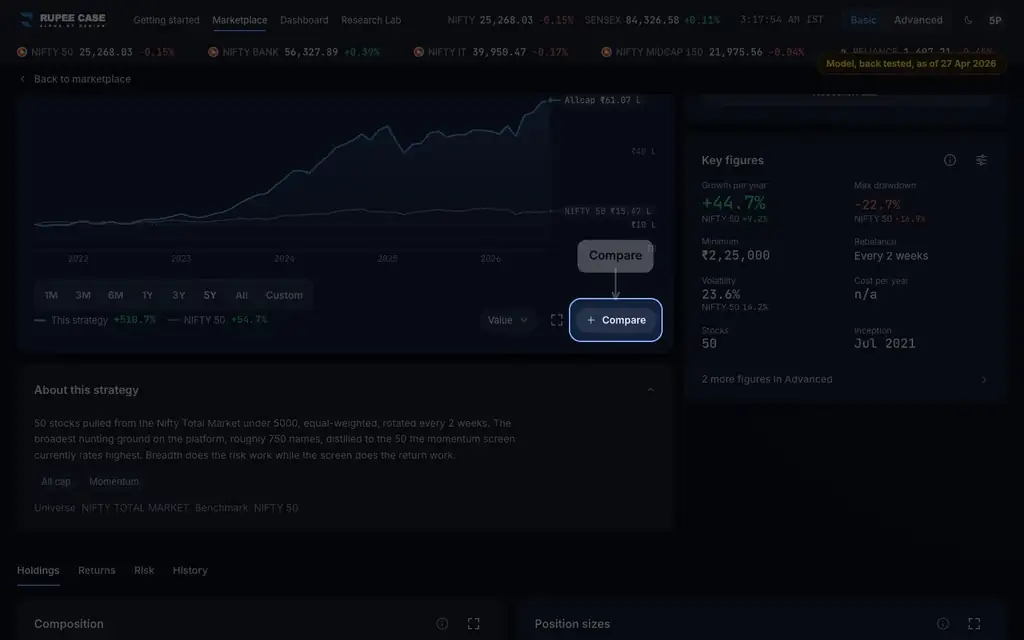
The Returns tab of a strategy page, first card. Basic and Advanced; its Table button is in Advanced.
What it means
The Compare card ranks the lines on the chart (the strategy, its primary benchmark and your picks) as bars over the chosen period. Under 12 months it ranks the plain return for the period; at 12 months or more it ranks growth per year. A line marks the primary benchmark. In Advanced, Table lists each line's return, growth per year, max drawdown, volatility, Sharpe, best and worst month and positive weeks.
The formula
Under 12 months the bars are the return over the period; at 12 months or more they are growth per year. The reference line is the primary benchmark over the same window.
Under 12 months: return = last / first - 1
12 months or more: growth per year = (last / first) ^ (1 / years) - 1
Reference line = the primary benchmark, same window
Worked example
Example only
- 6 months: 100 to 110 is a +10% return
- 3 years: 100 to 172.8 is 20% a year (1.2 x 1.2 x 1.2 = 1.728)
- The label says which: "Return over the period" or "Growth per year"
How to read it
- Read the label under the bars first: return or growth per year.
- A bar past the benchmark line was ahead of it over the same window.
- Table (Advanced) puts risk figures beside the returns.
Watch out
- A 6 month return and a 3 year growth per year are not the same kind of number.
- The card follows the period chips; Marketplace cards do not.
- Index lines have no costs; strategy lines are after estimated charges.
Transcript
The video has no sound. These are its on screen captions, chapter by chapter.
- 0:00Where it is. The Compare card ranks every line on the chart.
- 0:09What it means. Over 12 months or more it ranks growth per year.
- 0:38Worked example. Worked example, example only: 6 months: 100 to 110 is a +10% return. 3 years: 100 to 172.8 is 20% a year (1.2 x 1.2 x 1.2 = 1.728). The label says which: "Return over the period" or "Growth per year".
- 0:44How to read it. In Advanced, Table lists each line's figures over the same window.
- 0:59Watch out. Watch out: A 6 month return and a 3 year growth per year are not the same kind of number. The card follows the period chips; Marketplace cards do not. Index lines have no costs; strategy lines are after estimated charges.
Terms in this tutorial
- CAGRCompound Annual Growth Rate.
- Nifty 50Index of 50 large-cap Indian stocks representing about 65 percent of NSE free-float market cap.
- Sharpe ratioRisk-adjusted return.