Where it is
ScreenMarketplaceBasic
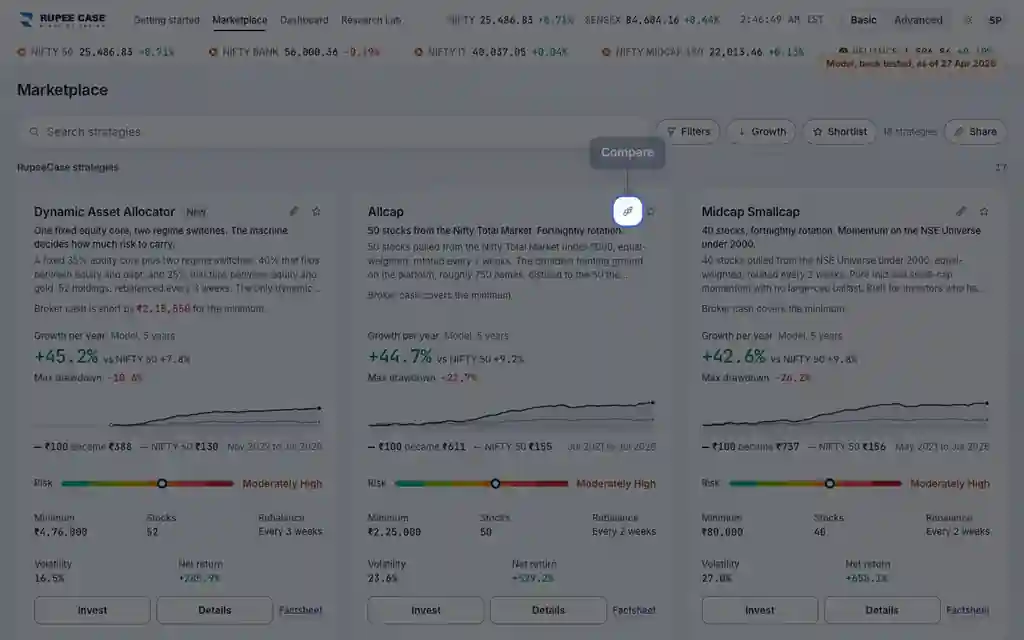
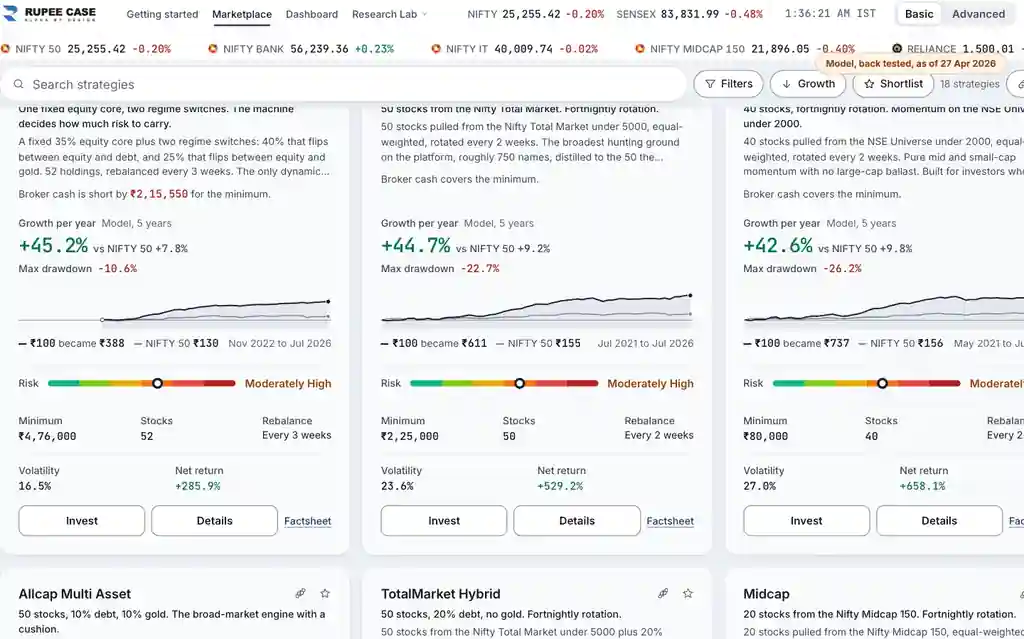
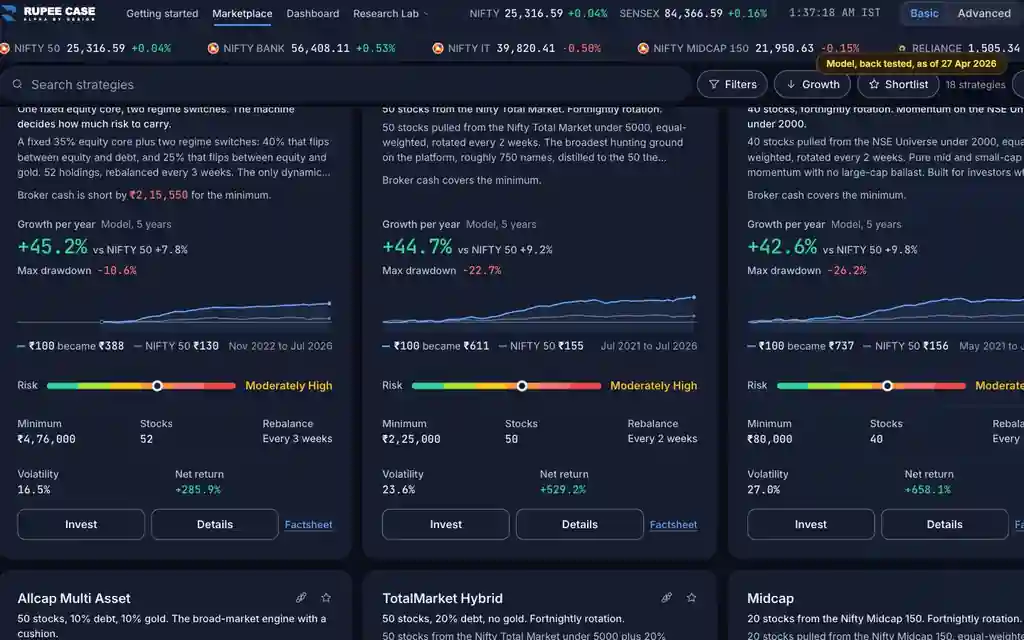
The Marketplace toolbar above the cards: Sort, Filters and the shortlist star. The Cards or Table layout is in Advanced (a list on a phone, a table on a wider screen).
What it means
Filters keep only the strategies that match every group you set: tier, risk, minimum and rebalance, plus cap segment, theme, stocks and source behind "More filters". Sort orders the cards by one figure, high to low or low to high. The star adds a strategy to your shortlist, and the shortlist switch shows only those. In Advanced the table sets the same figures out in columns, and Customise adds computed columns such as Calmar, worked out in the app from each strategy's history.
The formula
One choice per filter group; a strategy shows only when it matches every group you set. Sort uses each figure as the card shows it: model, full history, after estimated charges. A computed column loads each strategy's history first and uses the same arithmetic as the strategy page.
Shown = matches every filter group you set (one value per group)
Sort = one figure, high to low or low to high
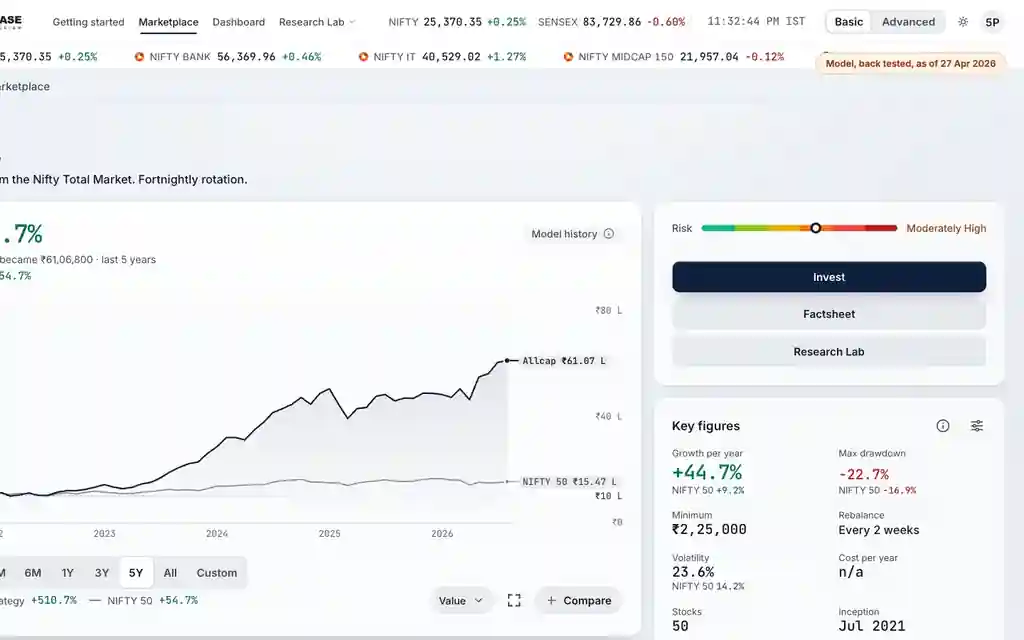
Computed column, for example Calmar = growth per year / size of the max drawdown
Worked example
Example only
- 20 strategies; Risk: High leaves 6
- Add Minimum up to Rs 1L: 4 of those 6 remain
- Calmar: 30% a year, max drawdown -20%: 30 / 20 = 1.5
How to read it
- "Show N strategies" counts what your filters leave.
- Every card figure is model history after charges over the full history, so a sort compares like with like.
- Filters, sort and layout stay on this device; Share this view puts them in a link.
Watch out
- A sort orders past model figures; it is not a recommendation.
- Computed columns load each strategy's history, so they can take a moment.
- The table is in Advanced; in Basic a saved table waits and the cards show.
Transcript
The video has no sound. These are its on screen captions, chapter by chapter.
- 0:00Where it is. Sort, Filters and the shortlist sit above the cards.
- 0:20What it means. Pick one value in a group: here Risk, Moderately High.
- 0:59Worked example. Worked example, example only: 20 strategies; Risk: High leaves 6. Add Minimum up to Rs 1L: 4 of those 6 remain. Calmar: 30% a year, max drawdown -20%: 30 / 20 = 1.5.
- 1:05How to read it. In Advanced the layout can be a list; a wider screen shows a table.
- 1:31Watch out. Watch out: A sort orders past model figures; it is not a recommendation. Computed columns load each strategy's history, so they can take a moment. The table is in Advanced; in Basic a saved table waits and the cards show.
Terms in this tutorial
- CAGRCompound Annual Growth Rate.
- drawdownThe peak-to-trough decline during a specific period.
- Sharpe ratioRisk-adjusted return.
- Sortino ratioLike Sharpe but only penalises downside volatility.