Where it is
ScreenStrategyBasic
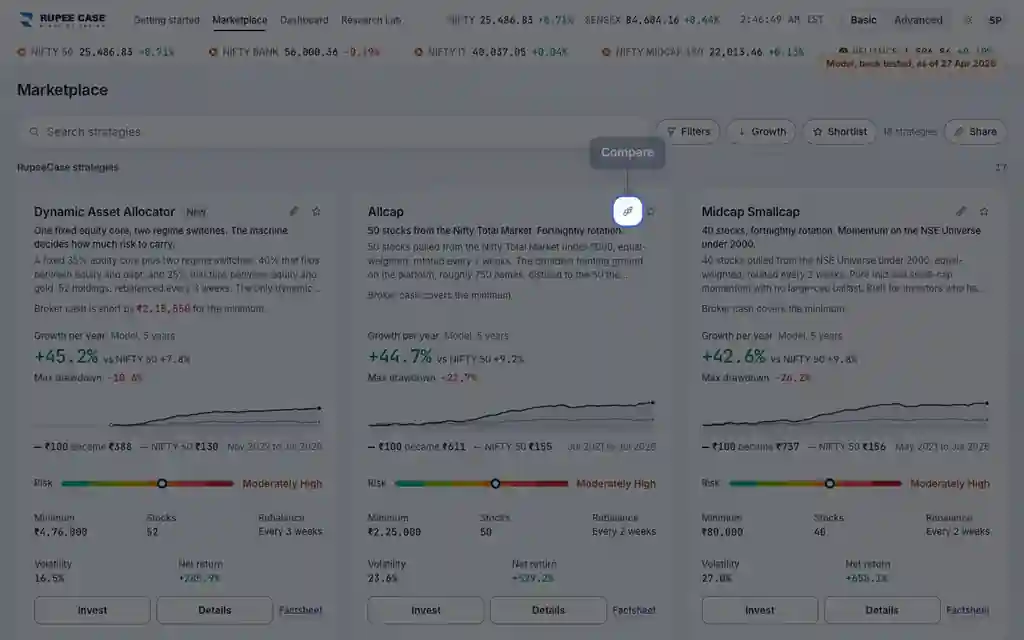
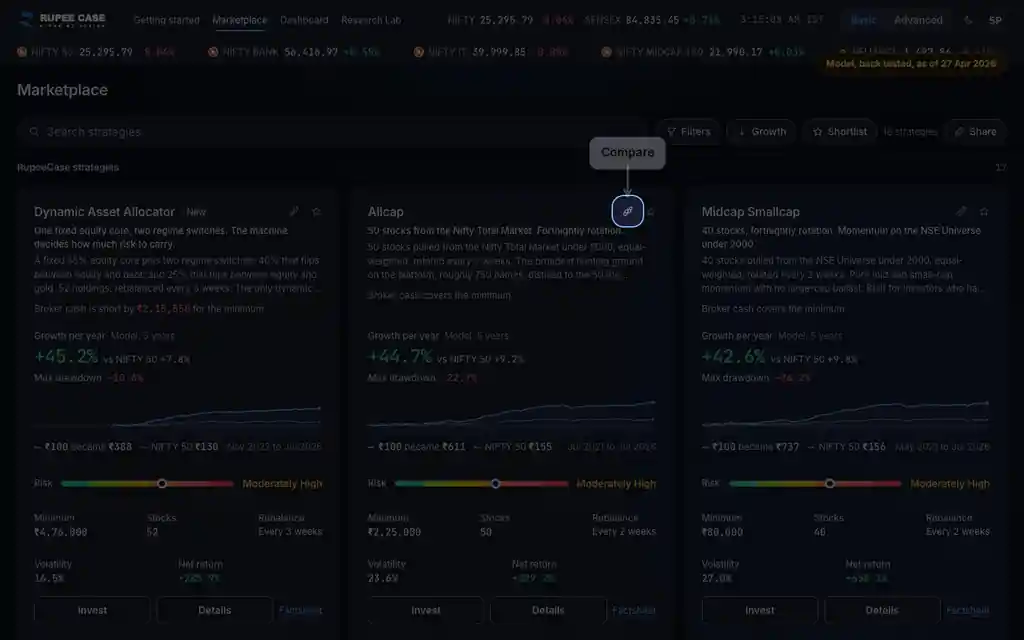
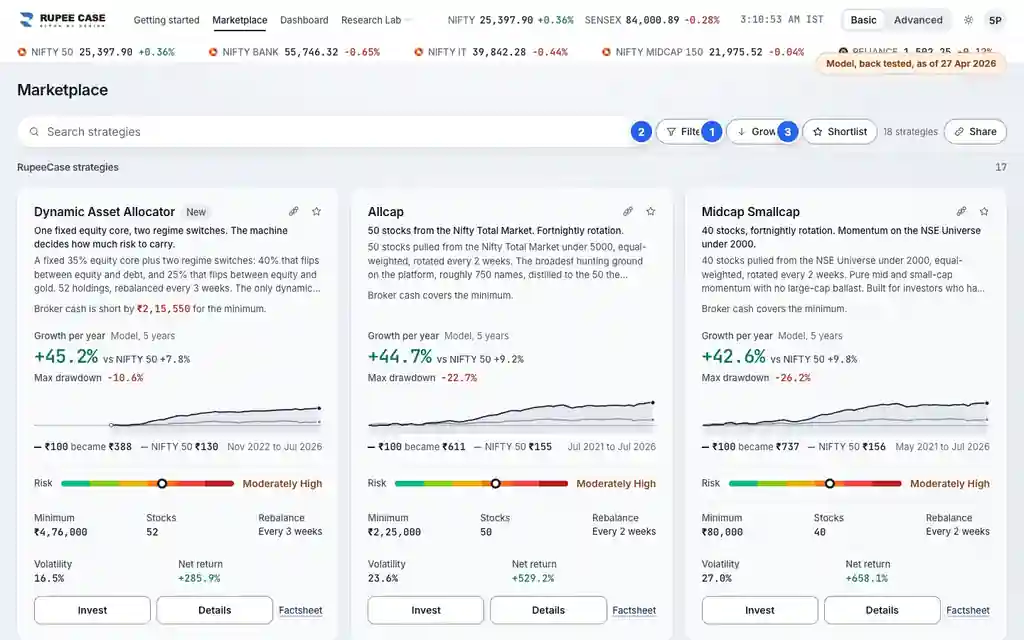
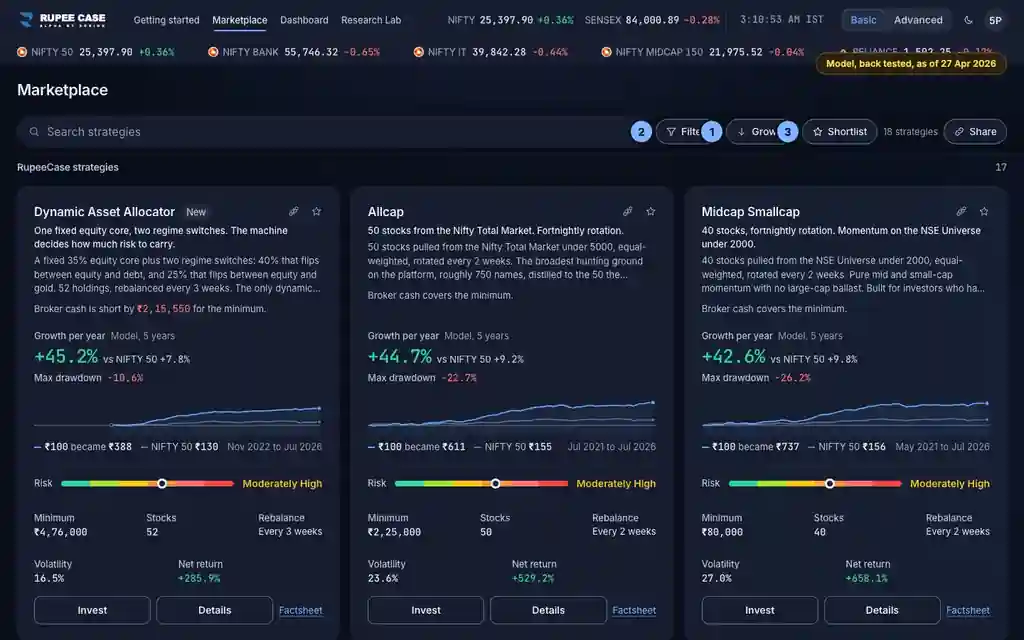
The Compare button under the strategy chart opens "Compare with": a search box, the primary benchmark, then Indices, Mutual funds and Strategies. Pick up to 3 and press Done. Basic and Advanced.
What it means
Every line starts at 100 on the window's first point, so growth reads side by side. The kinds differ: an index line is the index level, a price index with no costs; a fund line is the NAV of the fund's plan, after its expense ratio; a strategy line is model history after estimated charges. The primary benchmark at the top of the picker is the line the key figures and tabs measure against, and that choice is saved for every strategy page.
The formula
Each line is its value divided by its value on the window's first point, times 100. Index: price level, no costs. Fund: NAV after the expense ratio. Strategy: model after estimated charges.
Line = value / value on the first point of the window x 100
Index: index level, no costs (a price index: dividends are not added)
Fund: NAV of the fund's plan, after its expense ratio
Strategy: model history after estimated charges
Primary benchmark: saved for every strategy page
Worked example
Example only
- Strategy 100 to 160, index 100 to 130 over the same window
- Strategy +60%, index +30%: a 30 point gap
- The index has no costs; the strategy line is after charges
How to read it
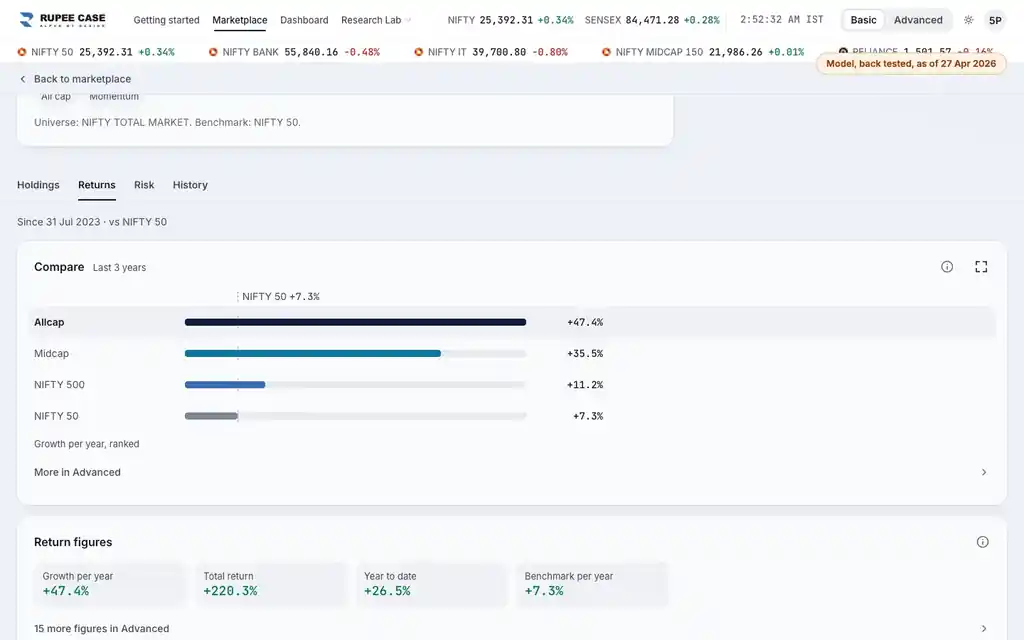
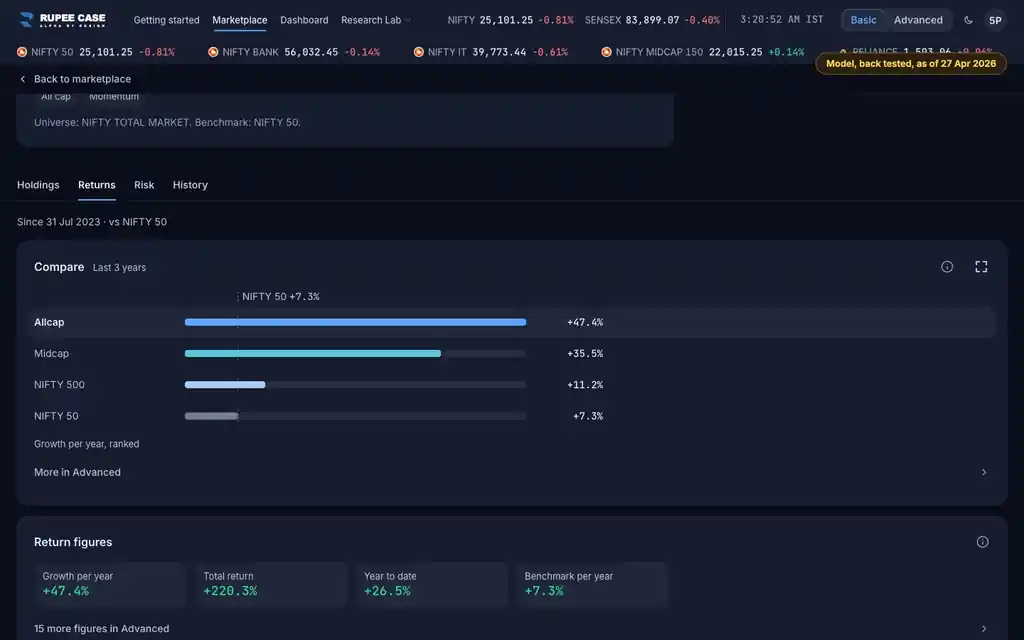
- The legend gives each line's return at the end of the window.
- An index has no costs, a fund is after its expense ratio, a strategy is after estimated charges.
- Up to 3 picks, plus the primary benchmark.
Watch out
- Changing the primary benchmark changes it on every strategy page and every figure that uses it.
- Index lines are price indices: dividends paid by the companies are not added.
- Your picks are saved on this device.
Transcript
The video has no sound. These are its on screen captions, chapter by chapter.
- 0:00Where it is. Compare, under the chart, adds other lines.
- 0:15What it means. An index line is the index level: a price index, with no costs.
- 1:02Worked example. Worked example, example only: Strategy 100 to 160, index 100 to 130 over the same window. Strategy +60%, index +30%: a 30 point gap. The index has no costs; the strategy line is after charges.
- 1:08How to read it. NIFTY 500 has no costs; Allcap and Midcap are after charges.
- 1:22Watch out. Watch out: Changing the primary benchmark changes it on every strategy page and every figure that uses it. Index lines are price indices: dividends paid by the companies are not added. Your picks are saved on this device.
Terms in this tutorial
- Nifty 500Broader index of 500 Indian stocks covering roughly 95 percent of free-float market cap.
- NAVNet Asset Value.
- expense ratioAnnual fee charged by a mutual fund as a percentage of AUM.
- index fundMutual fund that replicates an index.