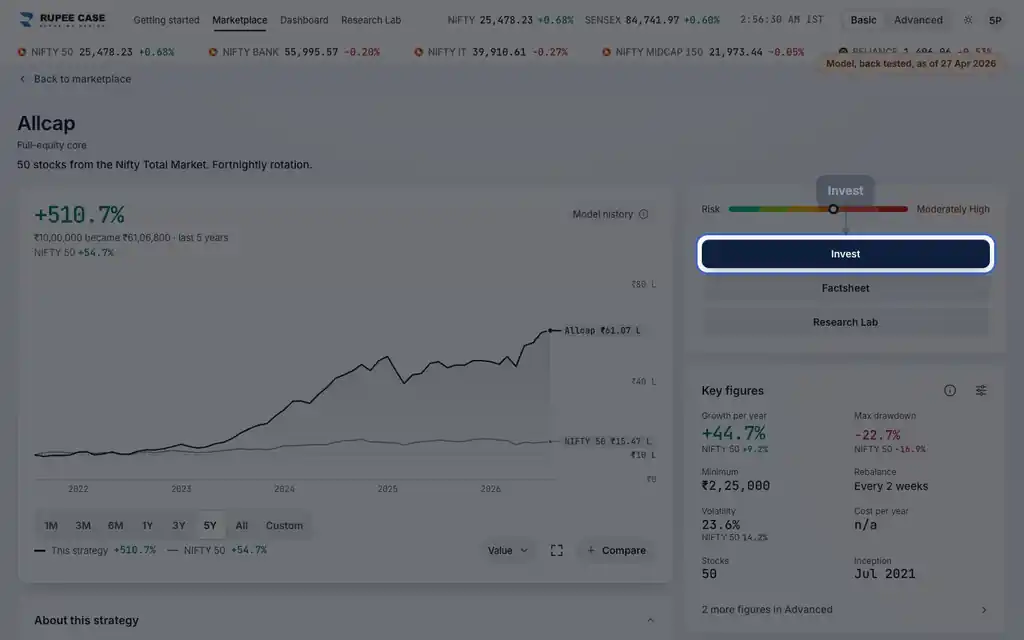
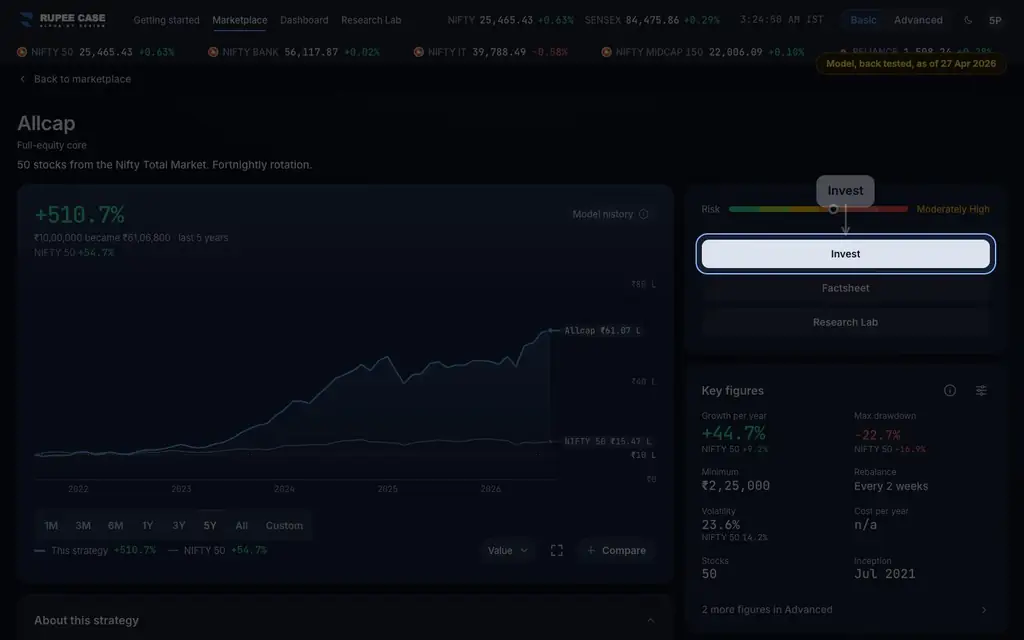
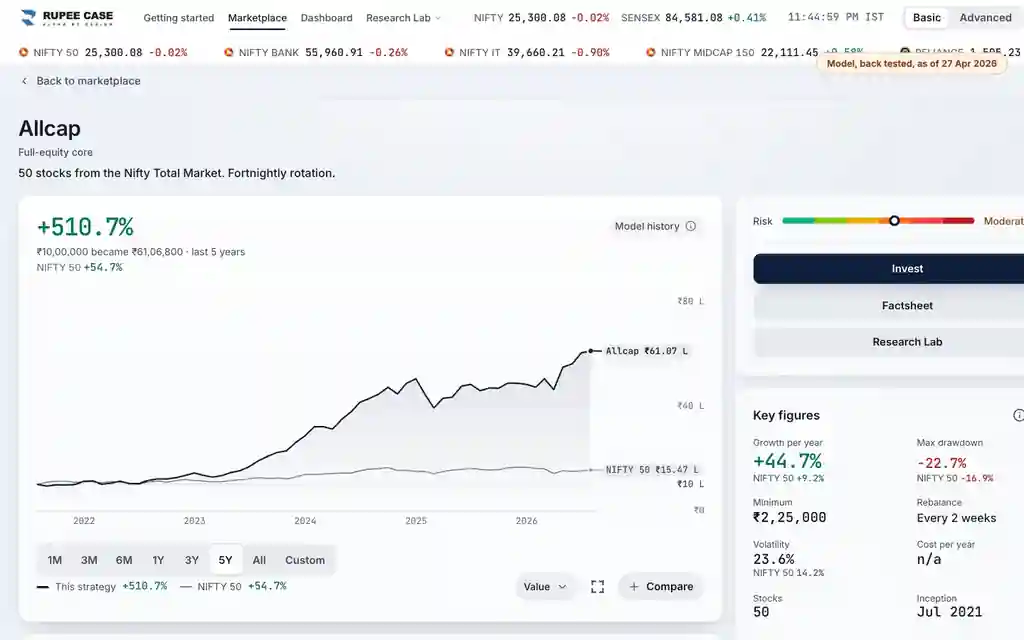
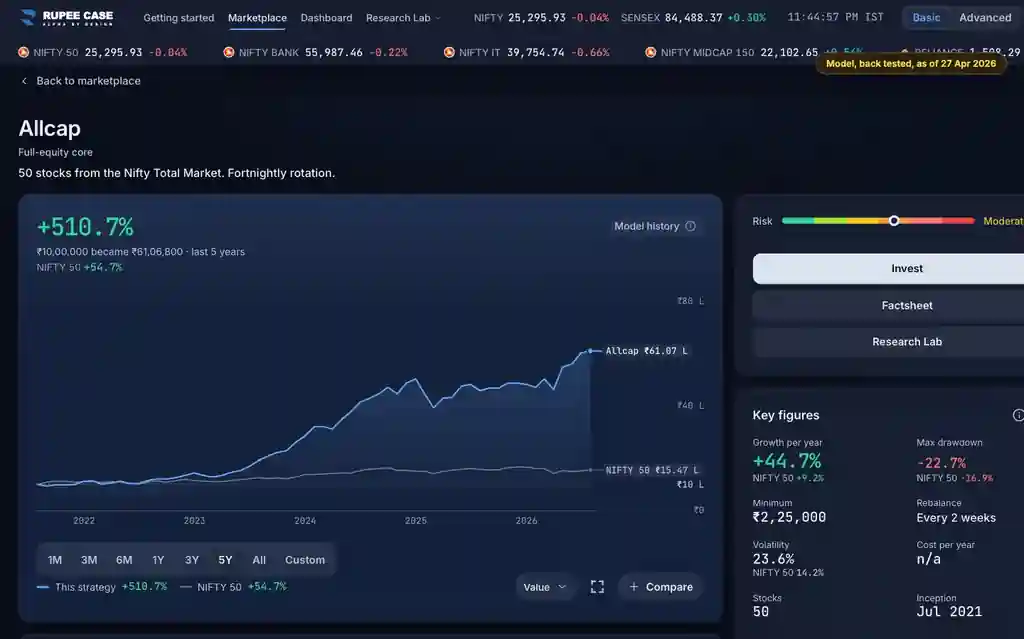
Where it is
ScreenStrategy chartBasic
The metric chip under the strategy chart (it reads "Value" at first). Value, Return and Drawdown are in Basic and Advanced; the rolling metrics and the Log chip are in Advanced.
What it means
Value draws Rs 10,00,000 put in at the window's start. Return draws the gain from the start, in percent. Drawdown draws the fall from the highest point before each date, so 0 means a new high. In Advanced, rolling return, the line against the benchmark, rolling volatility, Sharpe and beta draw a figure over a moving window ending at each date. Log puts equal percentage moves at equal heights, which keeps the early years readable on a long chart.
The formula
Return is the value over the value at the start, minus 1. Drawdown is the value over the highest value so far, minus 1. A rolling return is the value over the value one window earlier, minus 1. Log plots the logarithm of the value.
Value = Rs 10,00,000 x model value / model value at the window start
Return = value / value at the window start - 1
Drawdown = value / highest value so far - 1
Rolling return = value / value one window earlier - 1
Log scale: equal heights for equal percentage moves (Value only)
Worked example
Example only
- Rs 10,00,000 to Rs 15,00,000: Return +50%
- High Rs 15,00,000, now Rs 12,00,000: Drawdown -20%
- Log: 100 to 200 and 200 to 400 rise by the same height
How to read it
- The chip names what the chart shows.
- Drawdown at 0% means the line is at a new high.
- Log helps on long windows, where early moves look flat.
Watch out
- Rolling metrics need enough history: a short series says "Needs more history".
- Log applies to Value only.
- The metric and the scale are saved on this device for every strategy page.
Transcript
The video has no sound. These are its on screen captions, chapter by chapter.
- 0:00Where it is. This chip sets what the chart draws: Value at first.
- 0:09What it means. Value: Rs 10,00,000 put in at the start of the window.
- 0:44Worked example. Worked example, example only: Rs 10,00,000 to Rs 15,00,000: Return +50%. High Rs 15,00,000, now Rs 12,00,000: Drawdown -20%. Log: 100 to 200 and 200 to 400 rise by the same height.
- 0:50How to read it. Advanced adds rolling figures over a moving window.
- 1:14Watch out. Watch out: Rolling metrics need enough history: a short series says "Needs more history". Log applies to Value only. The metric and the scale are saved on this device for every strategy page.
Terms in this tutorial
- drawdownThe peak-to-trough decline during a specific period.
- equity curveChart of portfolio value over time.
- volatilityHow much returns fluctuate.
- betaSensitivity of a portfolio to the market.