Where it is
ScreenRisk tab, Return distributionAdvanced
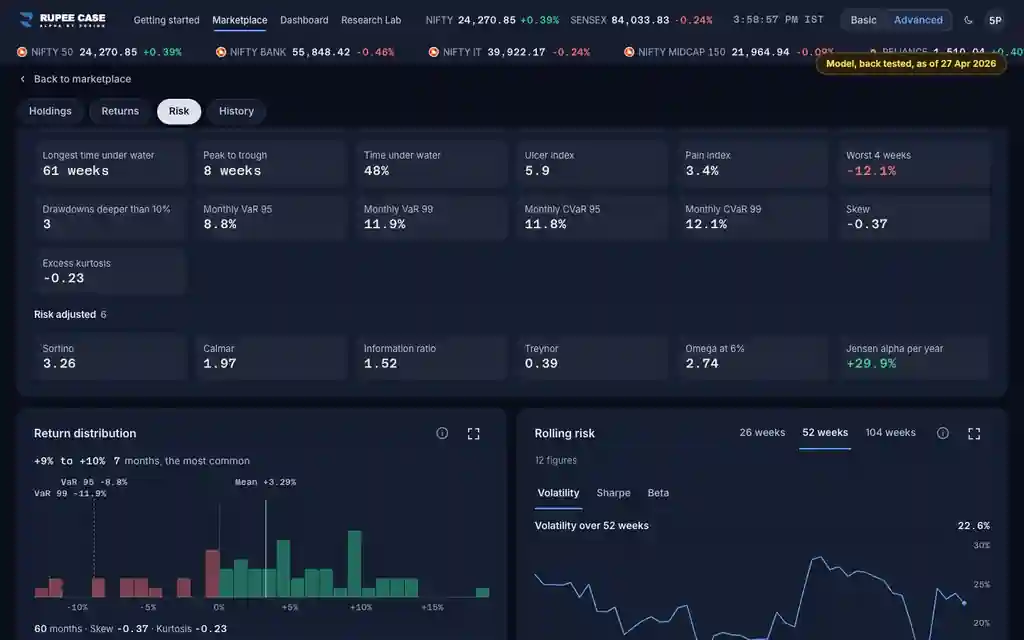
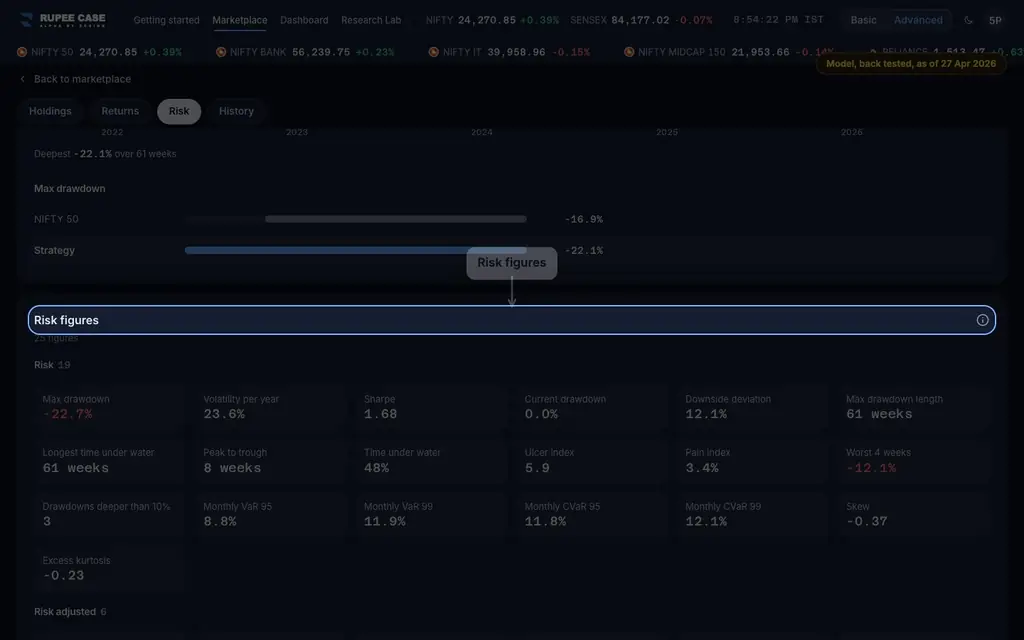
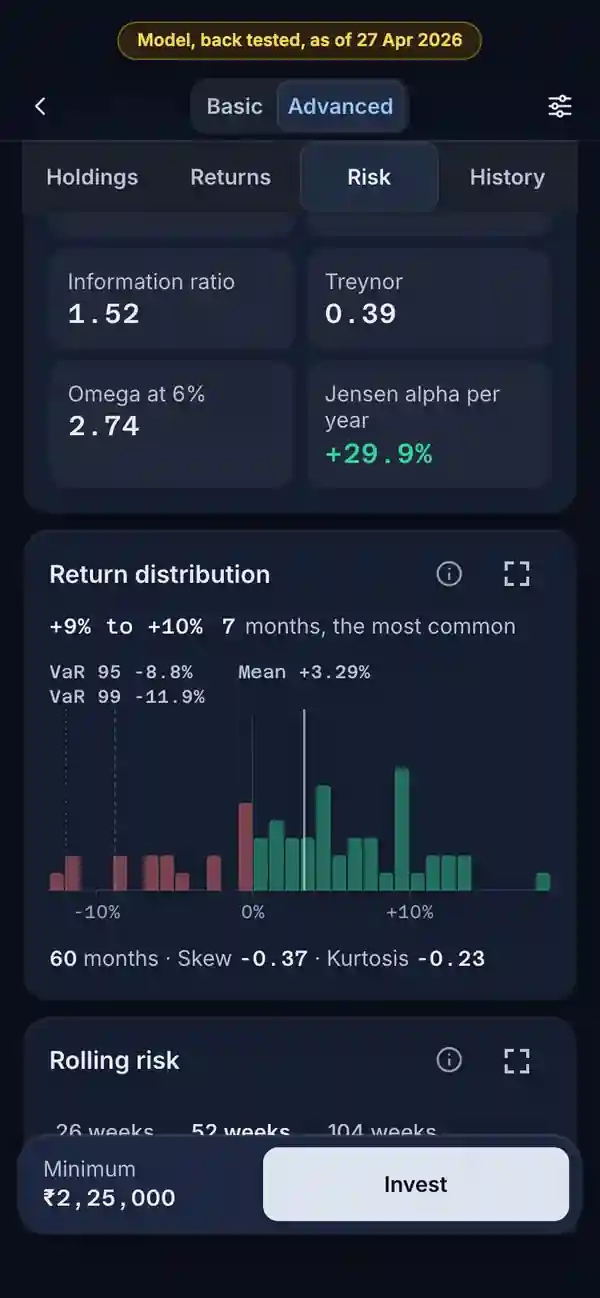
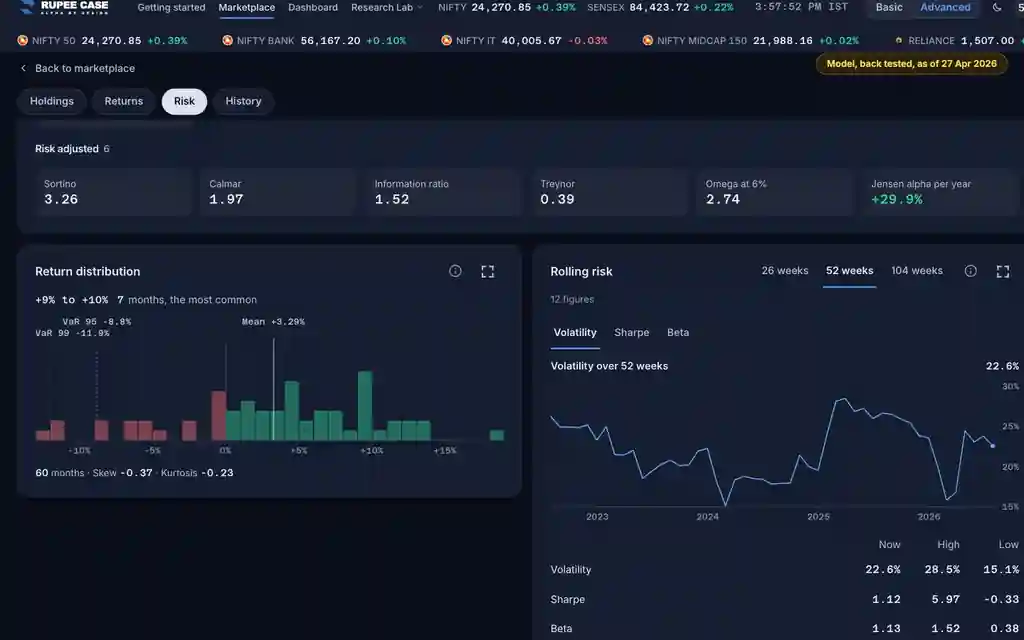
The Risk tab, in Advanced: the Return distribution card, and Skew and Excess kurtosis in the Risk figures card. On a portfolio both read the model since you invested.
Index in this video: Allcap (strategy page).
What it means
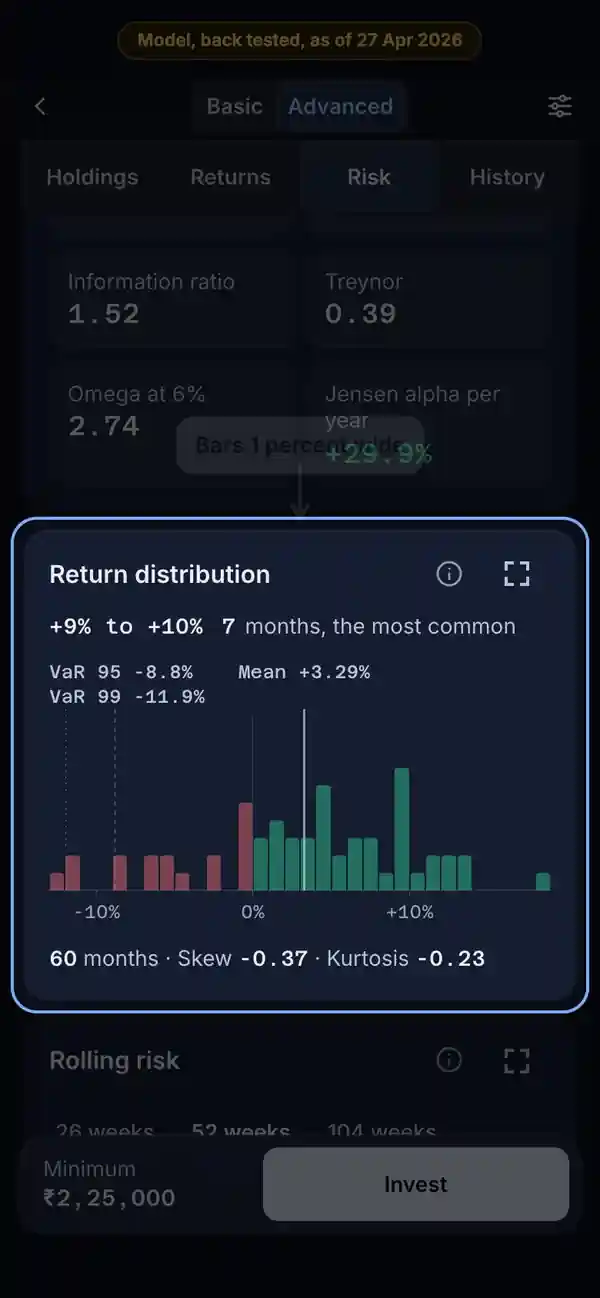
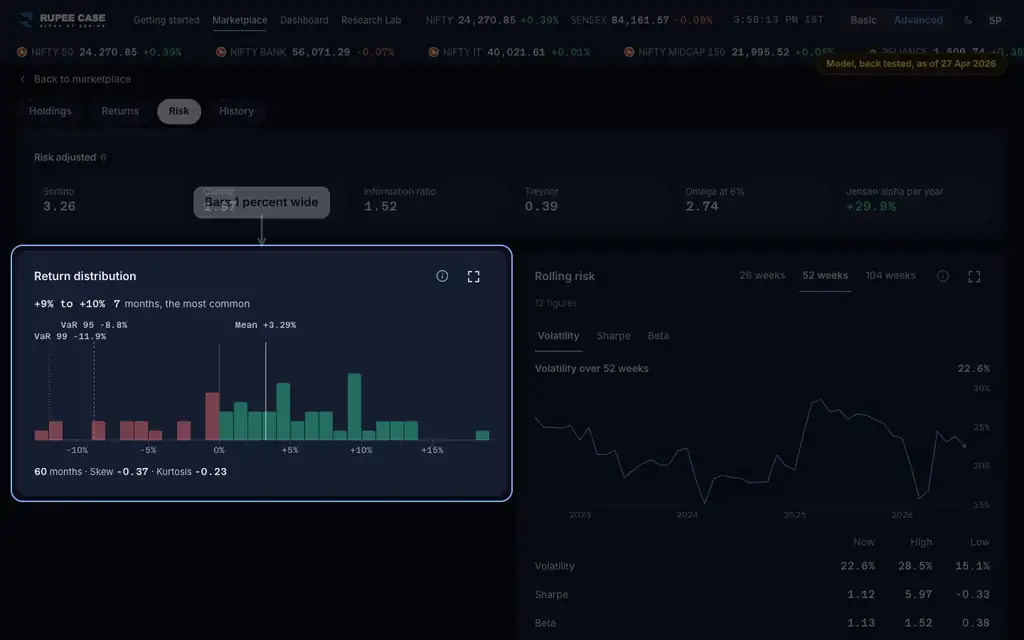
The histogram sorts every weekly return of the period into bars one percent wide, from -15% to +15% by default, refitted to the range the returns fill. Markers show the mean week, VaR 95 and VaR 99. Skew measures lopsidedness: below zero the long tail is on the losing side, above zero on the winning side. Excess kurtosis compares the tails with a normal curve: above zero means more extreme weeks than a normal curve would give. The card needs at least 20 weekly returns.
The formula
Count the weeks in each 1 percent band. Skew and excess kurtosis describe the shape: which side the long tail is on, and how heavy the tails are.
Bars: weekly returns, 1% wide, -15% to +15% (refitted; the ends fold into the end bars)
Markers: Mean, VaR 95, VaR 99
Skew = m3 / m2 ^ 1.5 (population moments of weekly returns)
Excess kurtosis = m4 / m2 ^ 2 - 3
Needs 20 weekly returns
Worked example
Example only
- 52 weeks: most between -2% and +3%
- Two weeks at -9% and -11%, none past +6%
- The long tail is on the left: skew below zero
How to read it
- Most bars near the middle and a few far left: the falls came in rarer, larger steps.
- Excess kurtosis above 0: more extreme weeks than a normal curve gives.
- Read VaR 95 against the bars: about 1 week in 20 lost more.
Watch out
- The caption says Kurtosis; the value is excess kurtosis, as the tile says.
- This recording reads month end history, so its bars are months.
- A few years of weeks is a small sample for the tails.
Transcript
Tap Sound on for voice and music. These are the captions of the video, chapter by chapter.
- 0:00Where it is. In Advanced, the Risk tab draws every return as a histogram.
- 0:10What it means. Each bar counts the periods in a 1 percent band; markers show the mean and VaR.
- 0:42Worked example. Worked example, example only: 52 weeks: most between -2% and +3%. Two weeks at -9% and -11%, none past +6%. The long tail is on the left: skew below zero.
- 0:48How to read it. How to read it: Most bars near the middle and a few far left: the falls came in rarer, larger steps. Excess kurtosis above 0: more extreme weeks than a normal curve gives. Read VaR 95 against the bars: about 1 week in 20 lost more.
- 0:54Watch out. Watch out: The caption says Kurtosis; the value is excess kurtosis, as the tile says. This recording reads month end history, so its bars are months. A few years of weeks is a small sample for the tails.
Terms in this tutorial
- Return distributionA bar chart of how many weeks fell into each band of return, from big losses on the left to big gains on the right.
- SkewA measure of whether the big surprises in returns tend to be gains or losses.
- Excess kurtosisA measure of how often returns were extreme compared with a normal bell curve.
- VaRValue at risk: a weekly loss that was matched or exceeded only rarely in the history.