Where it is
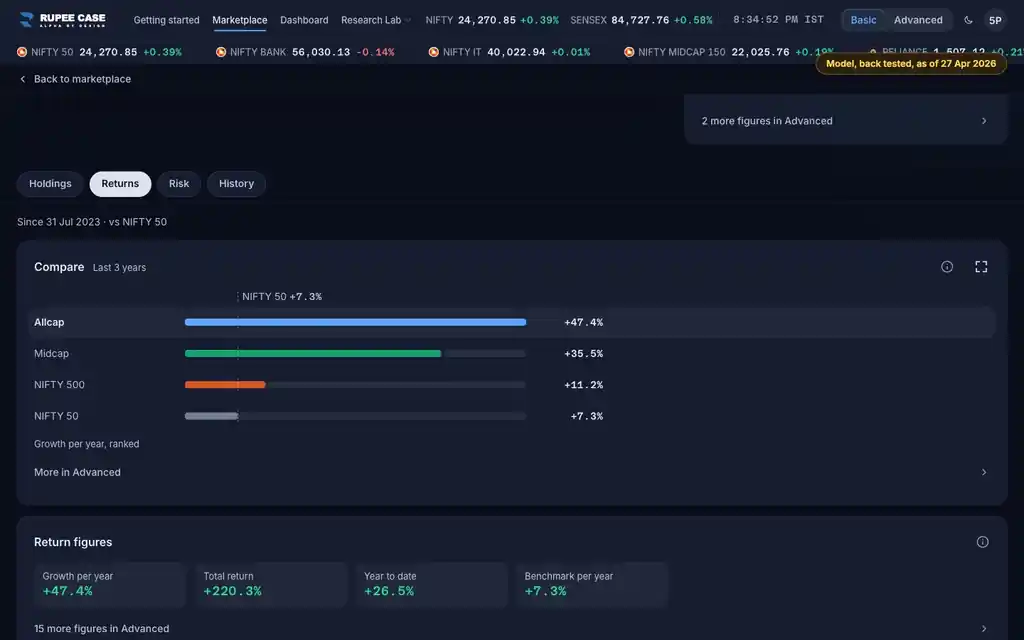
ScreenReturns tab, Return figuresBasic
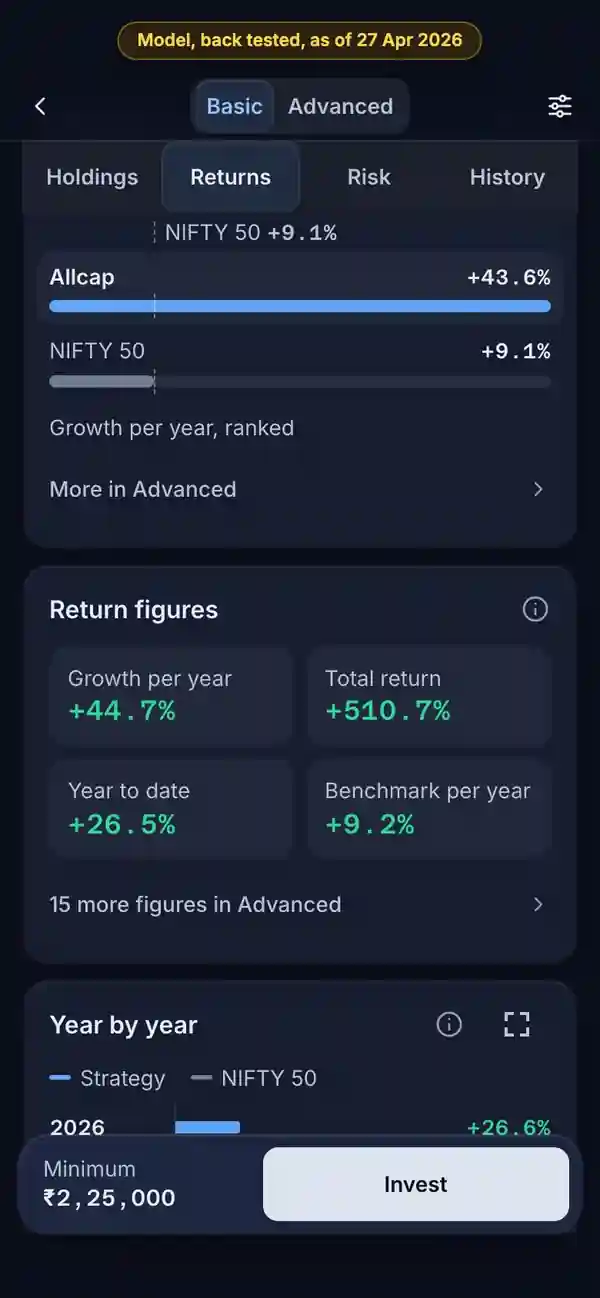
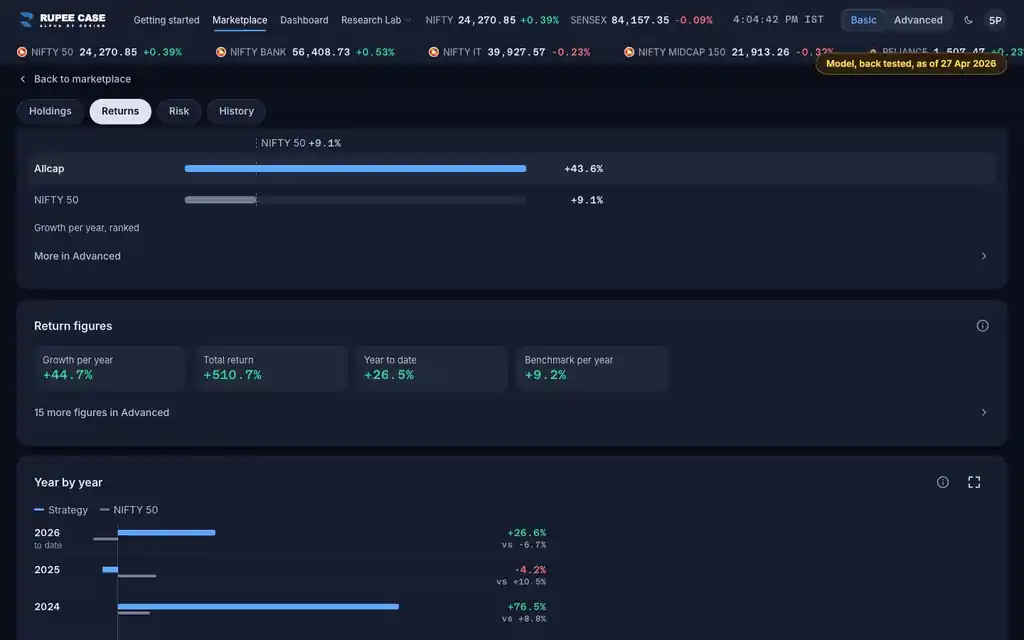
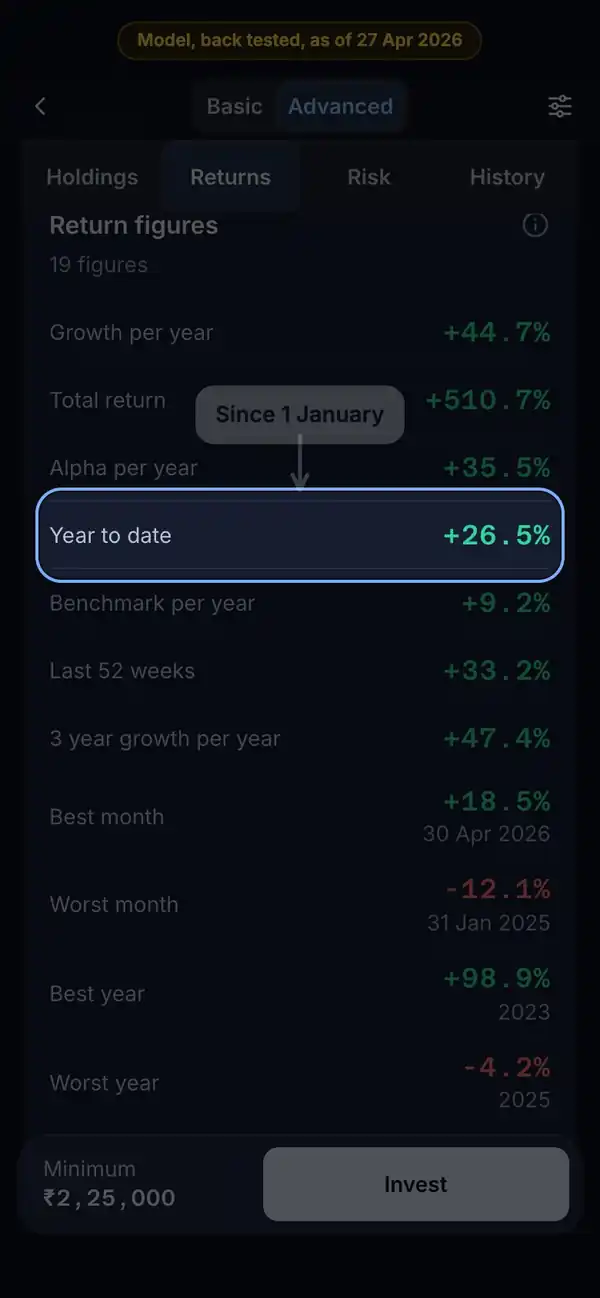
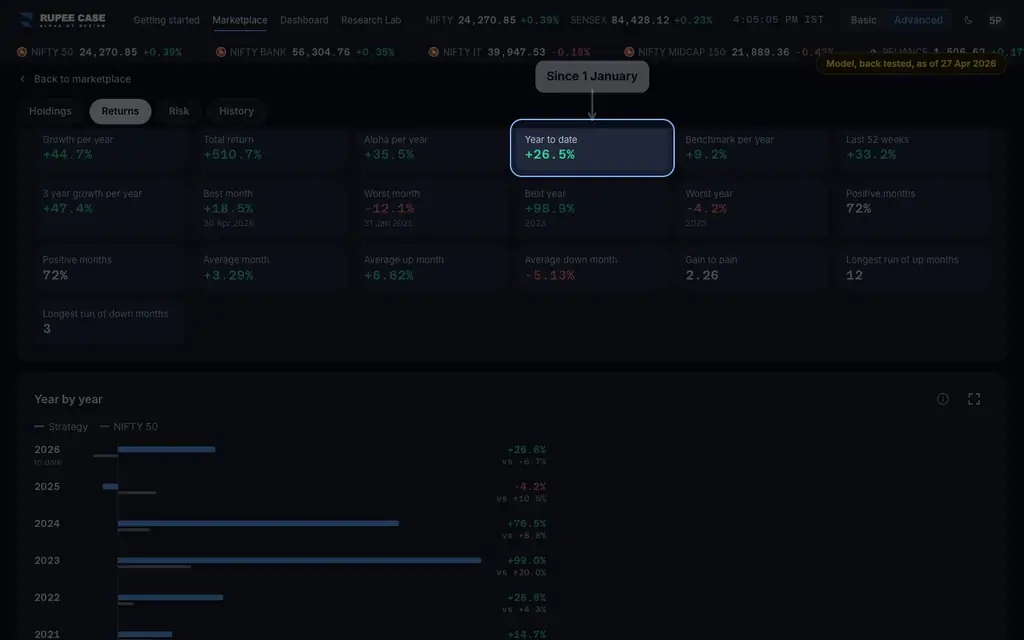
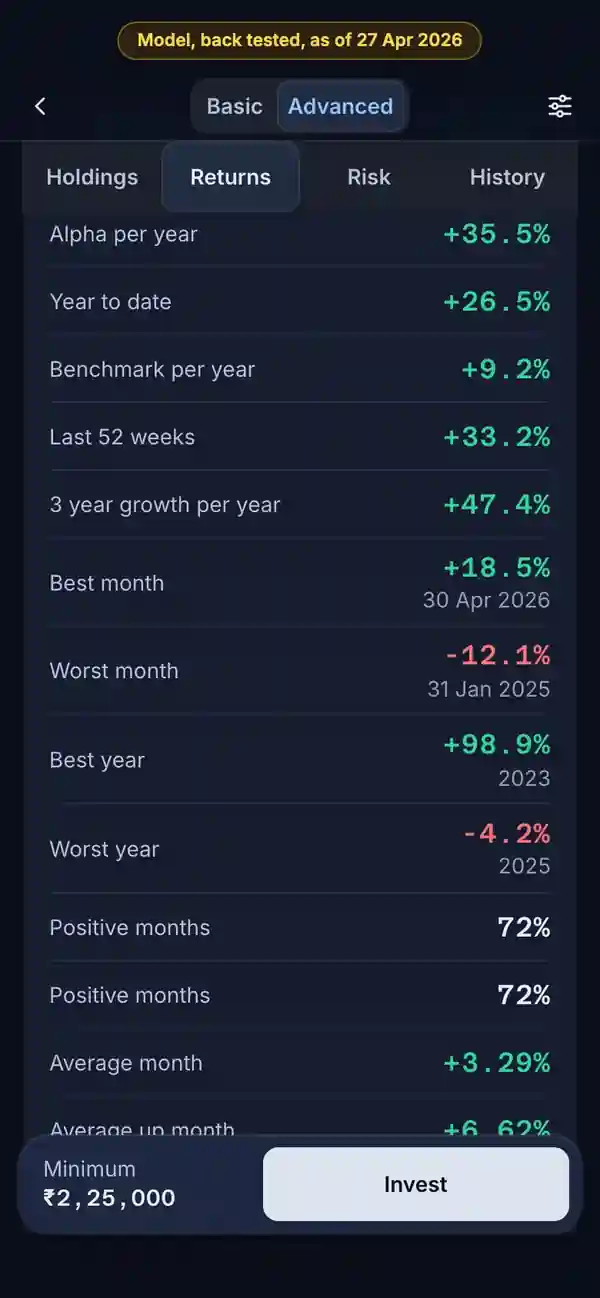
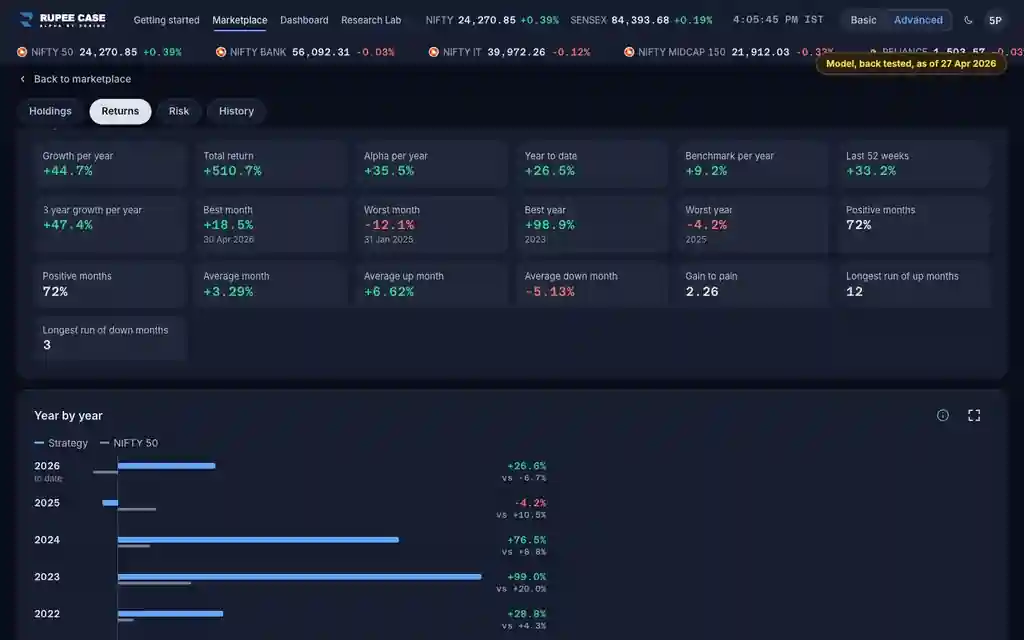
The Returns tab, Return figures card (strategy and portfolio). Basic shows Growth per year, Total return, Year to date and Benchmark per year; Advanced adds the rest. On a portfolio the card is the model since you invested.
Index in this video: Allcap (strategy page).
What it means
Year to date compares the latest value with the last value of the previous calendar year. Last 52 weeks looks back 364 days. Best and worst week, month and year are the extremes of the period; a part year is marked partial. Positive weeks is the share of weeks that ended up. Average week, Average up week and Average down week are plain means. Gain to pain adds up every weekly return and divides by the size of the losing weeks. The longest runs count weeks in a row up, or down.
The formula
All are worked out from the weekly values over the chosen period: returns from one week to the next, and calendar years and months from their last weeks.
Year to date = latest value / last value of the previous year - 1
Last 52 weeks = latest value / value 364 days back - 1
Positive weeks = weeks above 0 / all weeks
Gain to pain = sum of weekly returns / sum of the losing weeks' size
Best and worst year: calendar years; a part year is marked (partial)
Worked example
Example only
- Value 100 at the end of last year, 112 now: year to date +12%
- Weeks of +2%, -1%, +3%, -2%: 2 of 4 up, positive weeks 50%
- Gain to pain: (2 - 1 + 3 - 2) / (1 + 2) = 0.67
How to read it
- Year to date and Last 52 weeks differ early in a year: one starts on 1 January, the other a year back.
- Gain to pain above 1: the weekly gains added up to more than the losses.
- Best and worst month give the range; Year by year shows each year in full.
Watch out
- The In Basic list and the pin toast call Positive weeks Win rate; it is not beating the benchmark.
- This recording reads month end history, so the card says months where the app says weeks.
- A partial year can be a few weeks: read Best year with its label.
Transcript
Tap Sound on for voice and music. These are the captions of the video, chapter by chapter.
- 0:00Where it is. Return figures sits on the Returns tab.
- 0:08What it means. Year to date: since the last value of last year.
- 0:41Worked example. Worked example, example only: Value 100 at the end of last year, 112 now: year to date +12%. Weeks of +2%, -1%, +3%, -2%: 2 of 4 up, positive weeks 50%. Gain to pain: (2 - 1 + 3 - 2) / (1 + 2) = 0.67.
- 0:47How to read it. Best and worst year are calendar years; a part year is marked.
- 1:02Watch out. Watch out: The In Basic list and the pin toast call Positive weeks Win rate; it is not beating the benchmark. This recording reads month end history, so the card says months where the app says weeks. A partial year can be a few weeks: read Best year with its label.
Terms in this tutorial
- Year to dateThe return since the last value of the previous calendar year.
- Last 52 weeksThe return over the most recent 52 weeks, a rolling one year window that ends today rather than on 31 December.
- Best and worst periodsThe single best and single worst week, calendar month and calendar year in the history.
- Positive weeksThe share of weeks in which the value went up.
- Average weekThe mean of all weekly returns.
- Gain to painAll the weekly returns added up, divided by all the weekly losses added up as positive numbers.
- Longest run of up weeksThe most weeks in a row that ended higher, and the most in a row that ended lower.