Where it is
ScreenRisk tab, Drawdowns and Risk figuresAdvanced
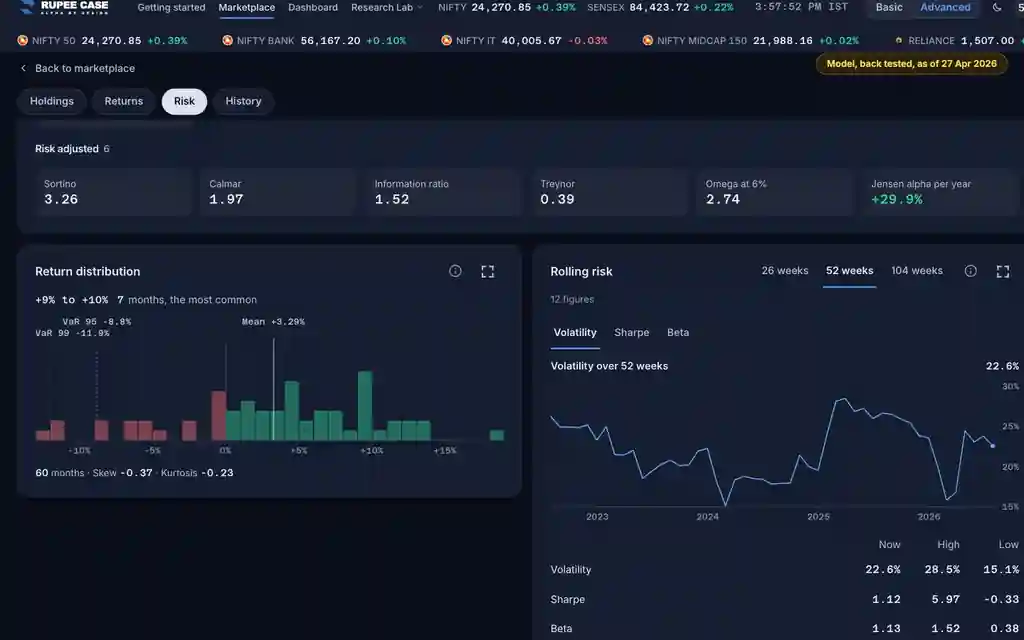
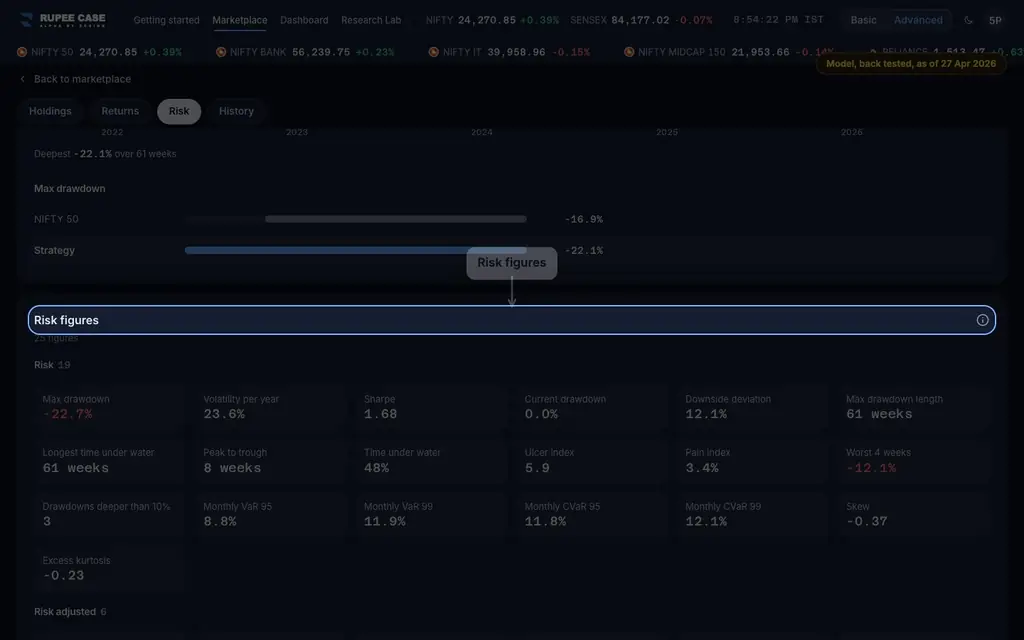
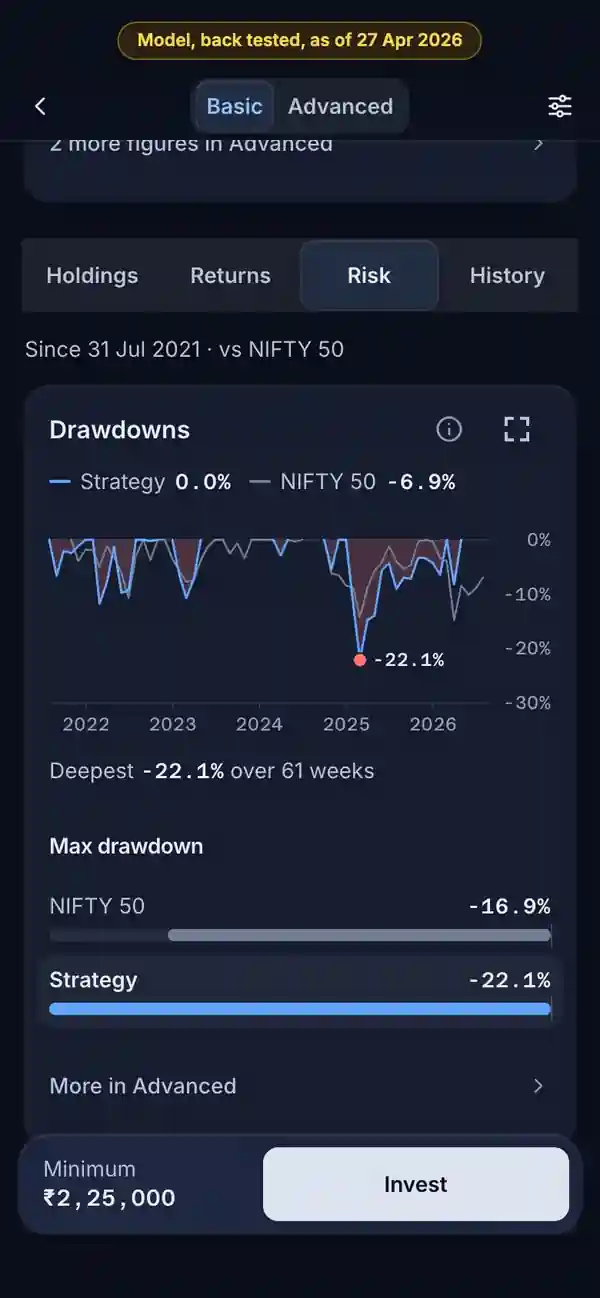
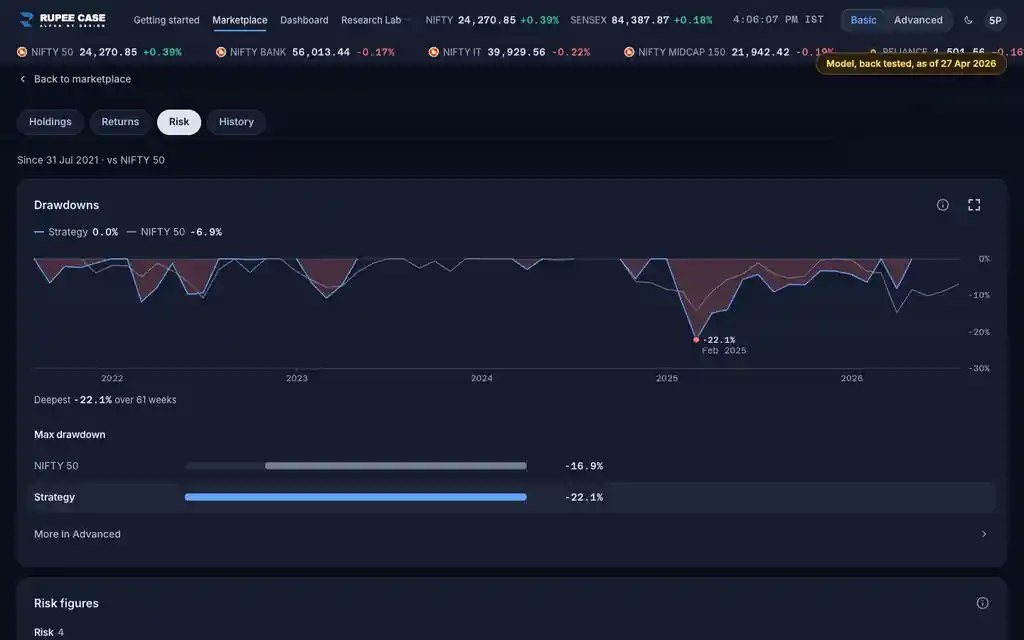
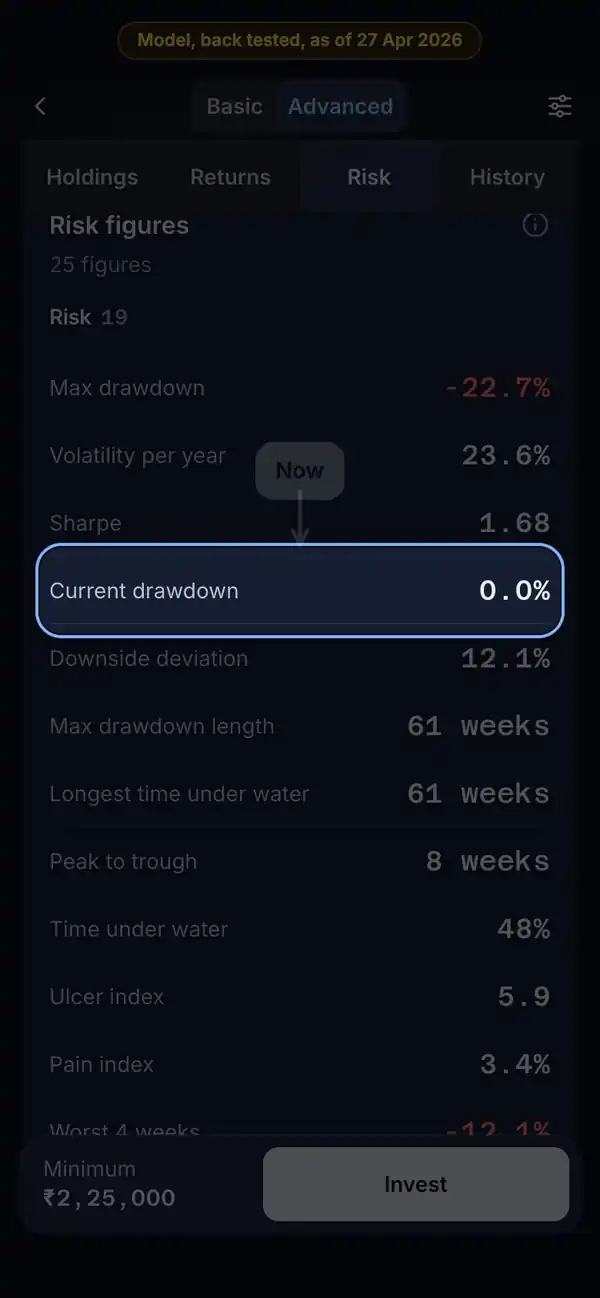
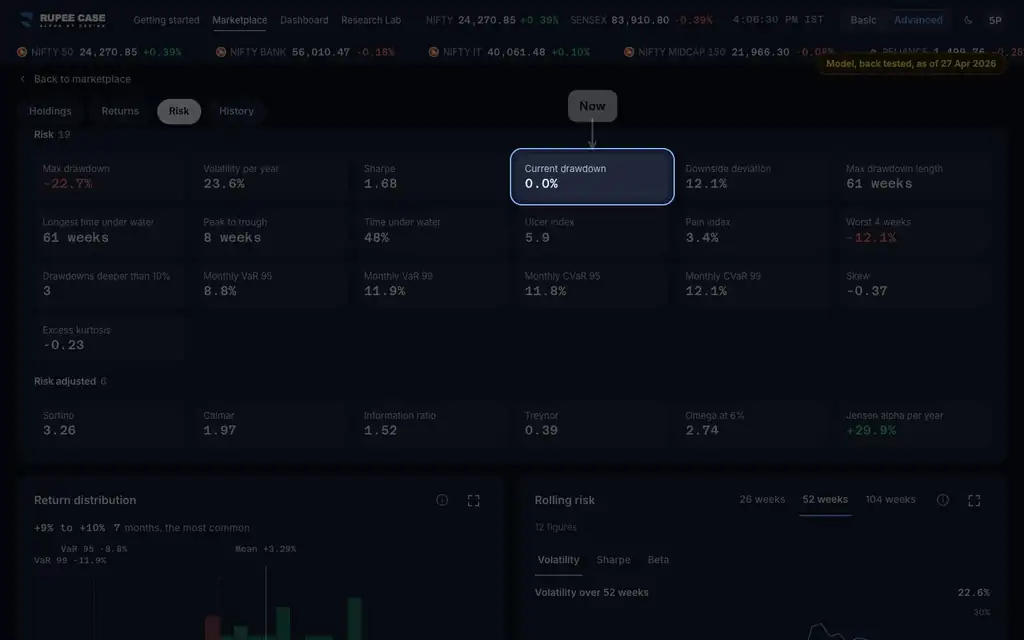
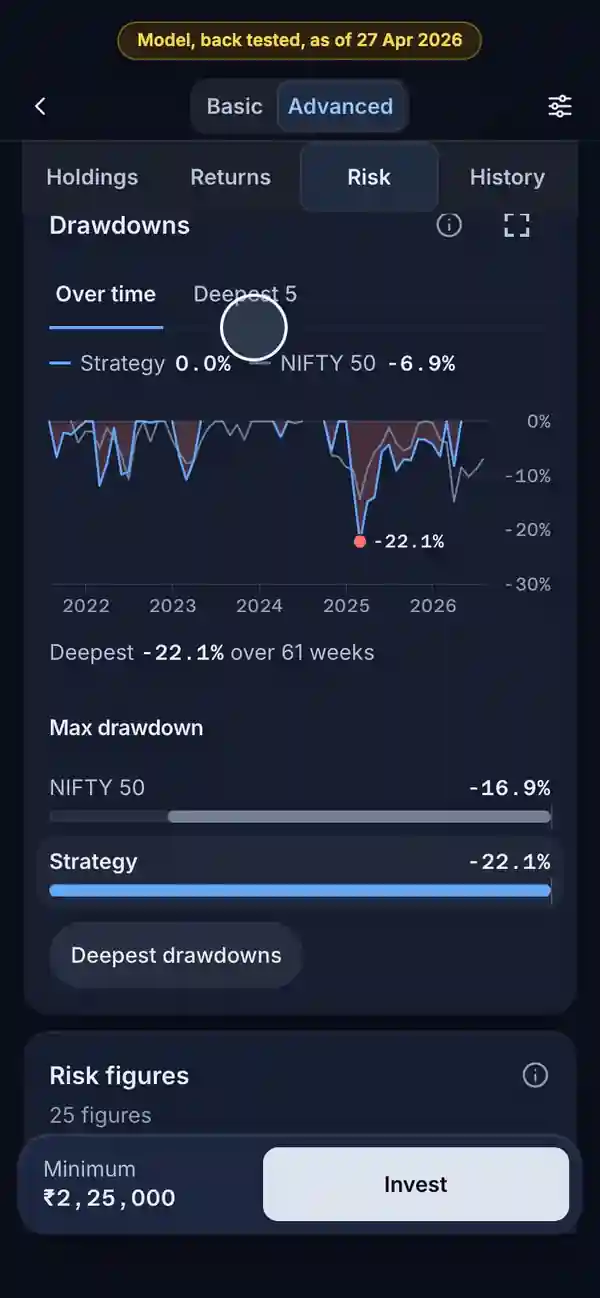
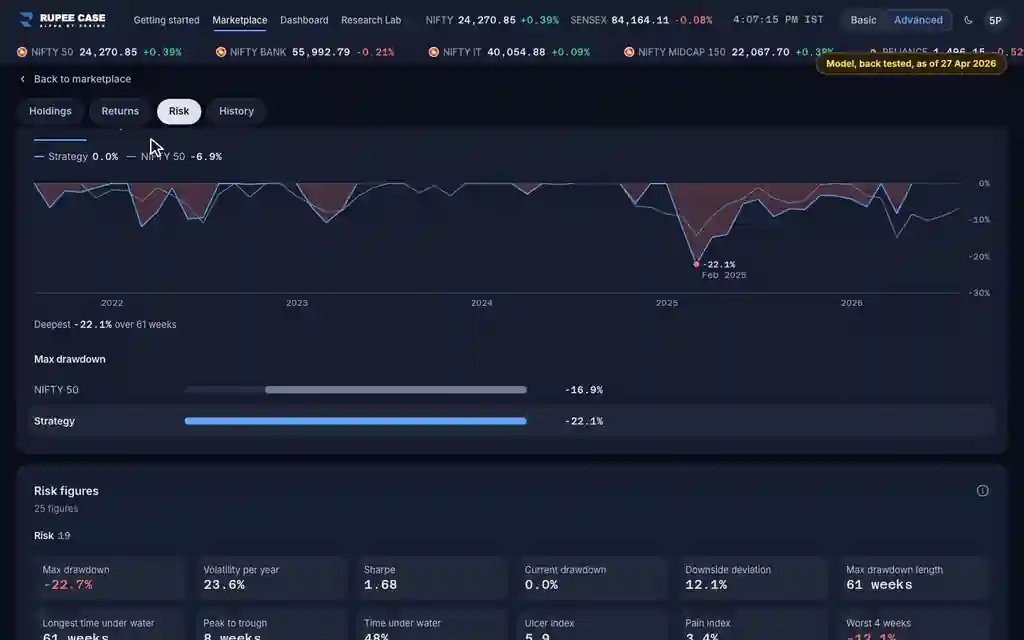
The Risk tab: the Drawdowns card (Over time; Deepest 5 in Advanced) and the Risk figures card. Current drawdown and Max drawdown length show in Basic; the others in Advanced.
Index in this video: Allcap (strategy page).
What it means
Max drawdown gives the deepest fall; these figures give the shape of the falls. Current drawdown is how far the latest value sits under its high. Time under water is the share of weeks spent below an earlier high, and Longest time under water the longest such stretch. The ulcer index squares every week's drawdown, averages the squares and takes the root, so long, deep falls weigh most; the pain index is the plain average drawdown. Worst 4 weeks is the weakest return over any four weeks, and Drawdowns deeper than 10% counts the falls past 10 percent.
The formula
Every figure starts from the drawdown each week: the value over the highest value so far, minus one.
Drawdown = value / running high - 1 (0 at a new high)
Current drawdown = the latest drawdown
Time under water = weeks below 0 / all weeks
Ulcer index = square root of the mean of (100 x drawdown) squared
Pain index = mean size of the drawdown
Worst 4 weeks = lowest of value / value 4 weeks earlier - 1
Max drawdown length: the deepest fall's weeks; Longest time under water: the longest fall's
Worked example
Example only
- Drawdowns over 4 weeks: 0%, -10%, -20%, 0%
- Pain index = (0 + 10 + 20 + 0) / 4 = 7.5%
- Ulcer index = square root of (0 + 100 + 400 + 0) / 4 = 11.2
How to read it
- Ulcer well above pain: some falls were deep, not only long.
- Time under water near 50%: about half the weeks sat below an earlier high.
- Deepest 5 gives each fall's peak, trough and weeks to recover.
Watch out
- Max drawdown length is the deepest fall's length; the longest is Longest time under water.
- This recording reads month end history, so Worst 4 weeks is one month here.
- On a portfolio these cards are the model since you invested.
Transcript
Tap Sound on for voice and music. These are the captions of the video, chapter by chapter.
- 0:00Where it is. The Risk tab draws every fall from the running high.
- 0:09What it means. Current drawdown: how far the latest value sits under its high.
- 0:42Worked example. Worked example, example only: Drawdowns over 4 weeks: 0%, -10%, -20%, 0%. Pain index = (0 + 10 + 20 + 0) / 4 = 7.5%. Ulcer index = square root of (0 + 100 + 400 + 0) / 4 = 11.2.
- 0:48How to read it. Deepest 5 lists the five deepest falls and their recovery.
- 1:12Watch out. Watch out: Max drawdown length is the deepest fall's length; the longest is Longest time under water. This recording reads month end history, so Worst 4 weeks is one month here. On a portfolio these cards are the model since you invested.
Terms in this tutorial
- Ulcer indexOne number for how deep and how long the falls below the high were.
- Pain indexThe average distance below the running high, over every week.
- Time under waterTime spent below a previous high, waiting to recover.
- Current drawdownHow far the value is right now below its highest point so far.
- Drawdowns deeper than 10%A count of the separate falls of more than 10 percent from a high, each counted once from its peak until it recovered.
- Worst 4 weeksThe biggest loss over any 4 weeks in a row in the history.
- drawdownThe peak-to-trough decline during a specific period.