Where it is
ScreenRisk tab, Risk figures and Market linkAdvanced
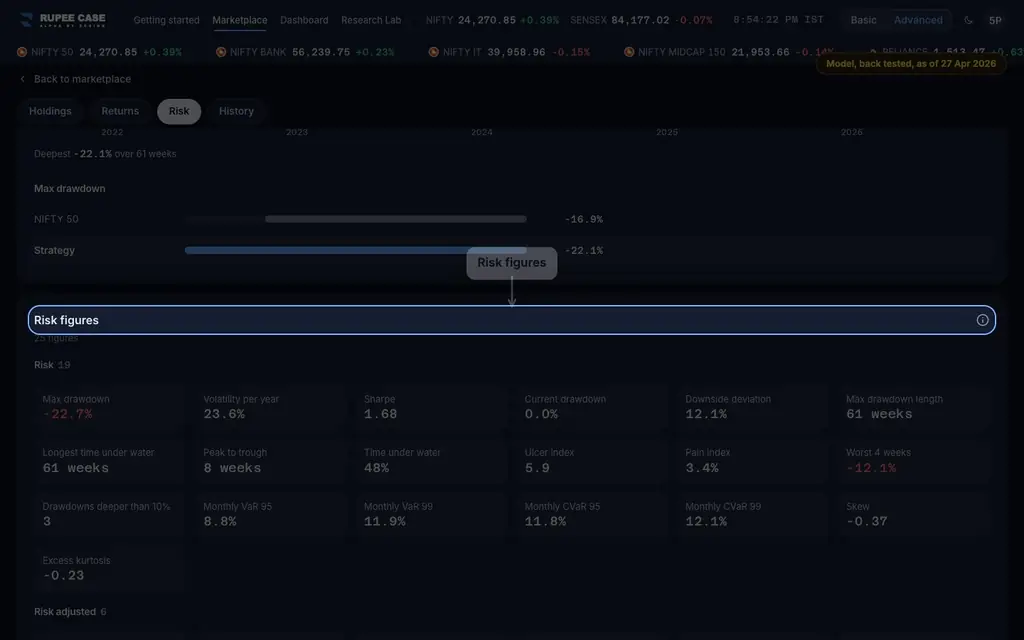
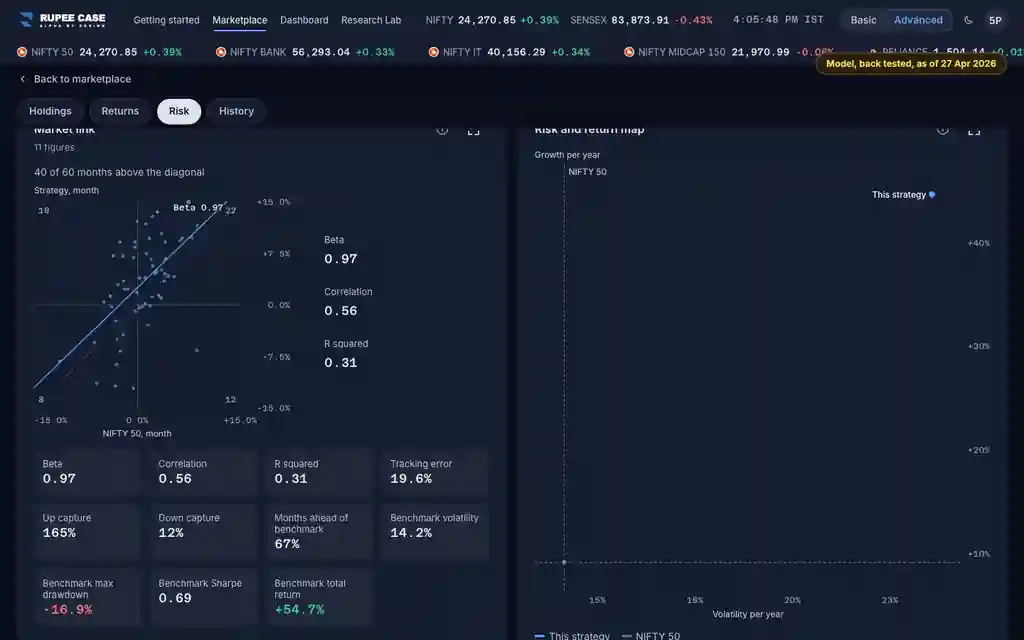
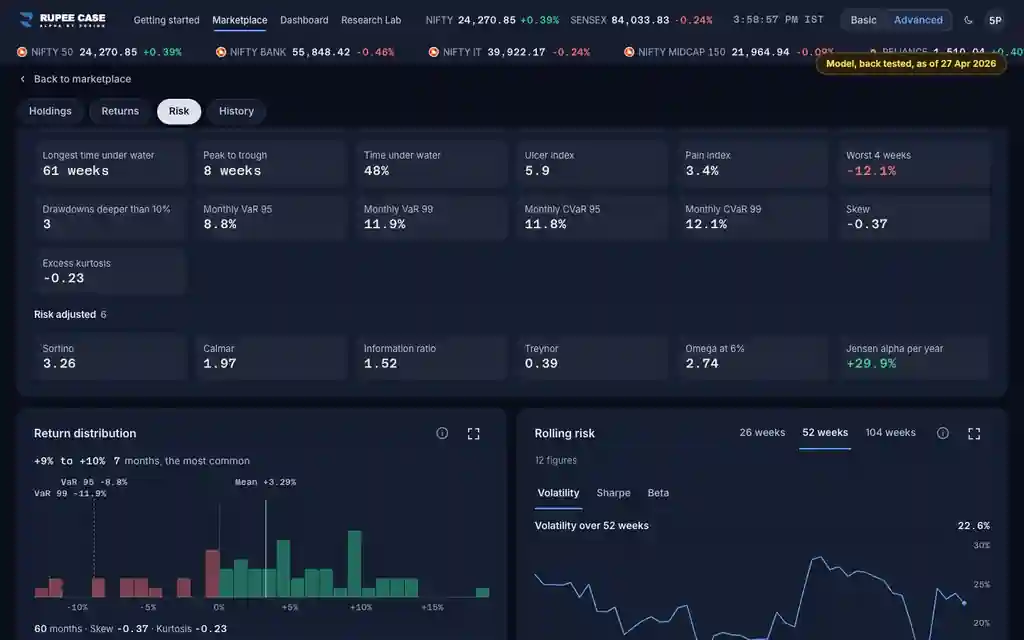
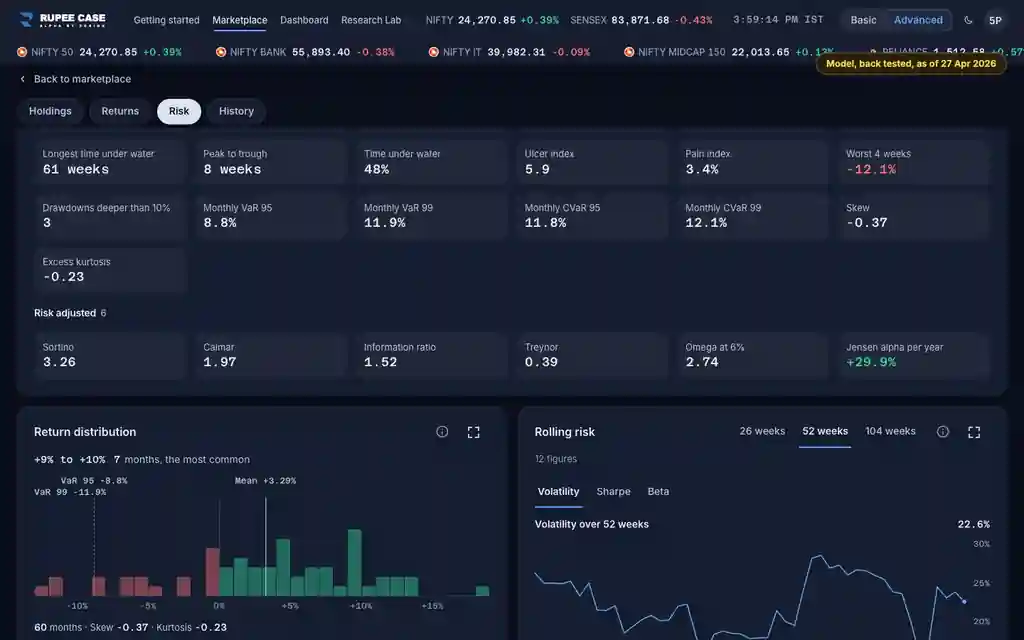
The Risk tab, in Advanced: Treynor and Omega at 6% in the Risk figures card, Risk adjusted group; Weeks ahead of benchmark in the Market link card.
Index in this video: Allcap (strategy page).
What it means
Treynor is growth per year above the 6 percent risk free rate, per unit of beta: the return for the market risk taken. It prints as a plain decimal, so 0.39 means 39 percentage points per unit of beta. Omega at 6% adds up every week's return above the 6 percent hurdle and divides by the shortfalls below it; above 1, the gains past the hurdle outweighed the shortfalls. Weeks ahead of benchmark is the share of common weeks in which the strategy returned more than its benchmark: the win rate of performance measurement.
The formula
Treynor and Omega both measure return past a 6 percent hurdle; weeks ahead counts how often the strategy beat its benchmark.
Treynor = (growth per year - 6%) / beta, shown when beta > 0
Omega at 6% = sum of (r - 6%/52) above 0 / sum of (6%/52 - r) above 0, weekly r
Weeks ahead = weeks the strategy beat the benchmark / common weeks
Worked example
Example only
- Growth 18% a year, beta 1.2: (18 - 6) / 1.2 = 10 points, Treynor 0.10
- Returns past the hurdle add to 30 points, shortfalls to 20: Omega 1.5
- Ahead in 30 of 52 weeks: 58%
How to read it
- Treynor compares strategies of similar beta; a beta near 0 makes it jump.
- Omega above 1: the gains past the hurdle outweighed the shortfalls.
- Weeks ahead above 50%: it beat the benchmark in more weeks than not.
Watch out
- Treynor shows as a decimal while other yearly figures show percent.
- Weeks ahead counts weeks, not by how much: a few large weeks can decide the return.
- This recording reads month end history, so the label reads Months ahead.
Transcript
Tap Sound on for voice and music. These are the captions of the video, chapter by chapter.
- 0:00Where it is. Treynor and Omega sit in Risk figures, in Advanced.
- 0:08What it means. Treynor: growth per year above 6 percent, per unit of beta.
- 0:36Worked example. Worked example, example only: Growth 18% a year, beta 1.2: (18 - 6) / 1.2 = 10 points, Treynor 0.10. Returns past the hurdle add to 30 points, shortfalls to 20: Omega 1.5. Ahead in 30 of 52 weeks: 58%.
- 0:42How to read it. How to read it: Treynor compares strategies of similar beta; a beta near 0 makes it jump. Omega above 1: the gains past the hurdle outweighed the shortfalls. Weeks ahead above 50%: it beat the benchmark in more weeks than not.
- 0:49Watch out. Watch out: Treynor shows as a decimal while other yearly figures show percent. Weeks ahead counts weeks, not by how much: a few large weeks can decide the return. This recording reads month end history, so the label reads Months ahead.
Terms in this tutorial
- TreynorReturn above a risk free rate for each unit of market sensitivity (beta).
- Omega at 6%The weekly gains above a 6 percent a year hurdle added up, divided by the weekly shortfalls below it added up.
- Weeks ahead of benchmarkThe share of weeks in which the strategy returned more than its benchmark.
- betaSensitivity of a portfolio to the market.
- Sharpe ratioReturn above a risk free rate for each unit of volatility.