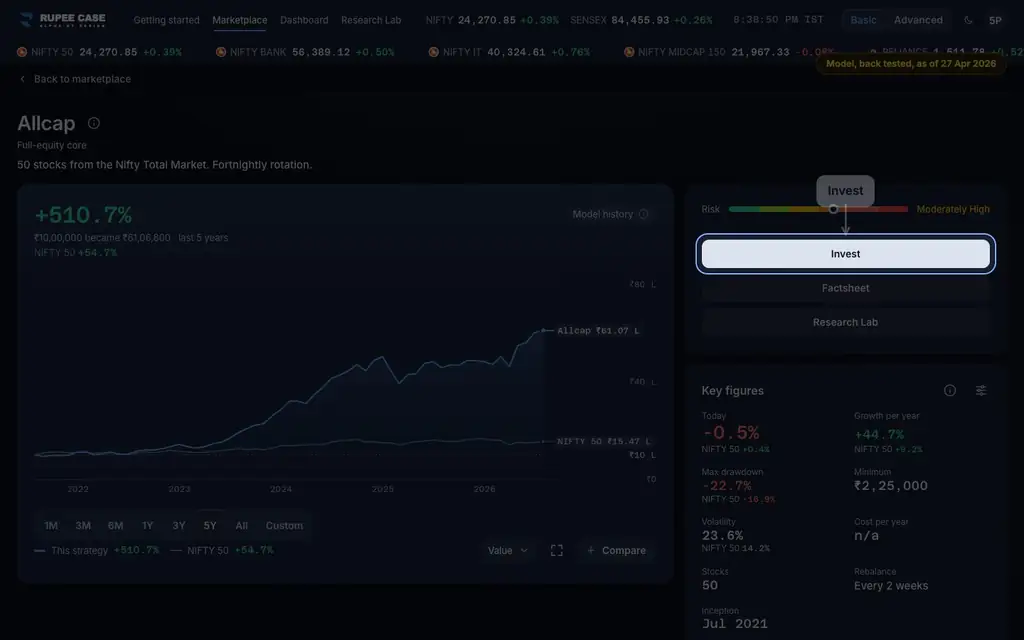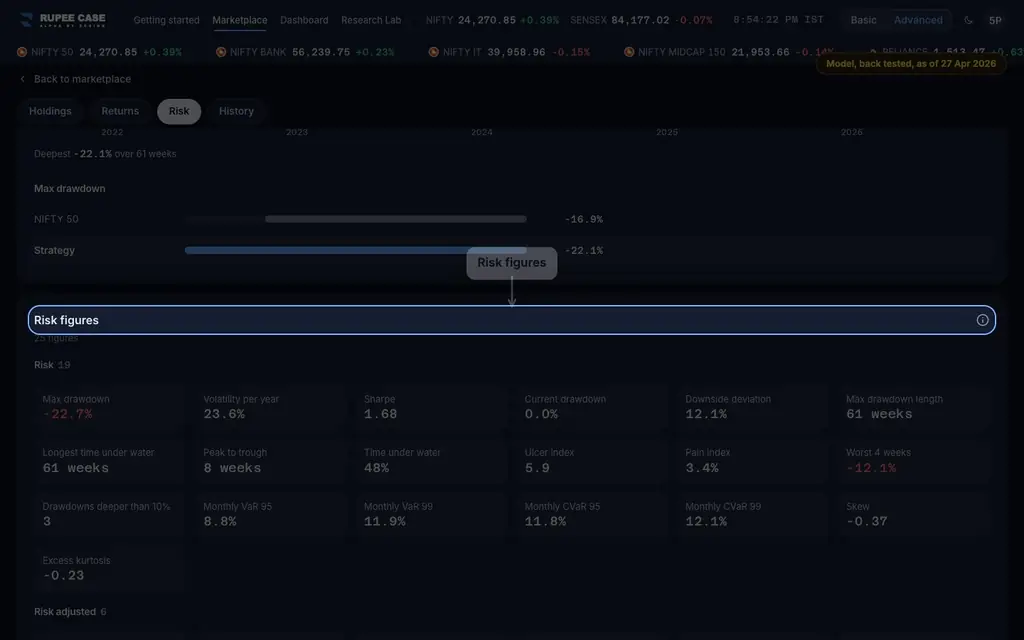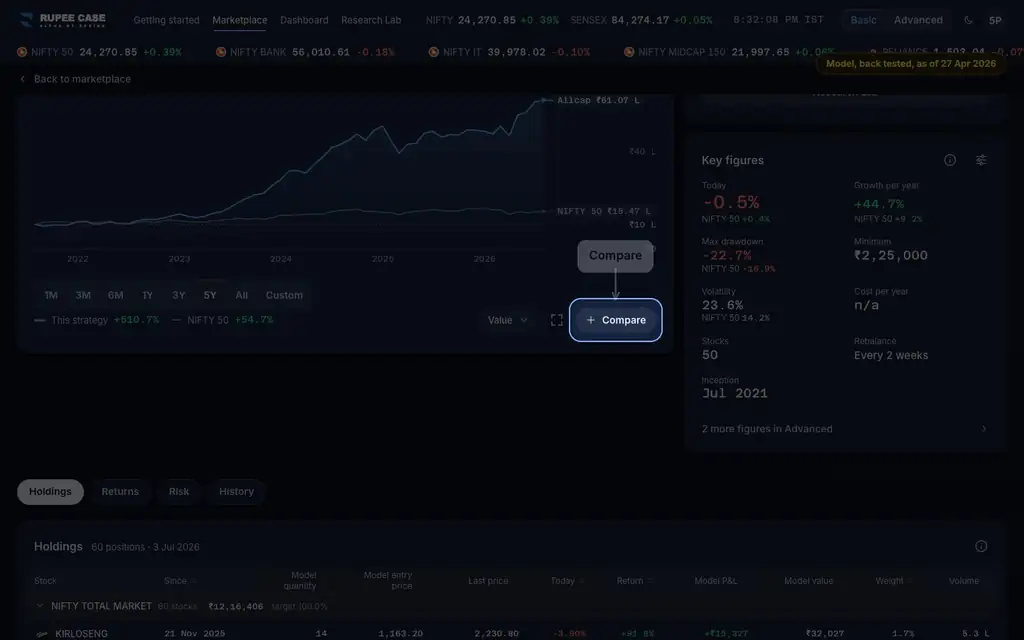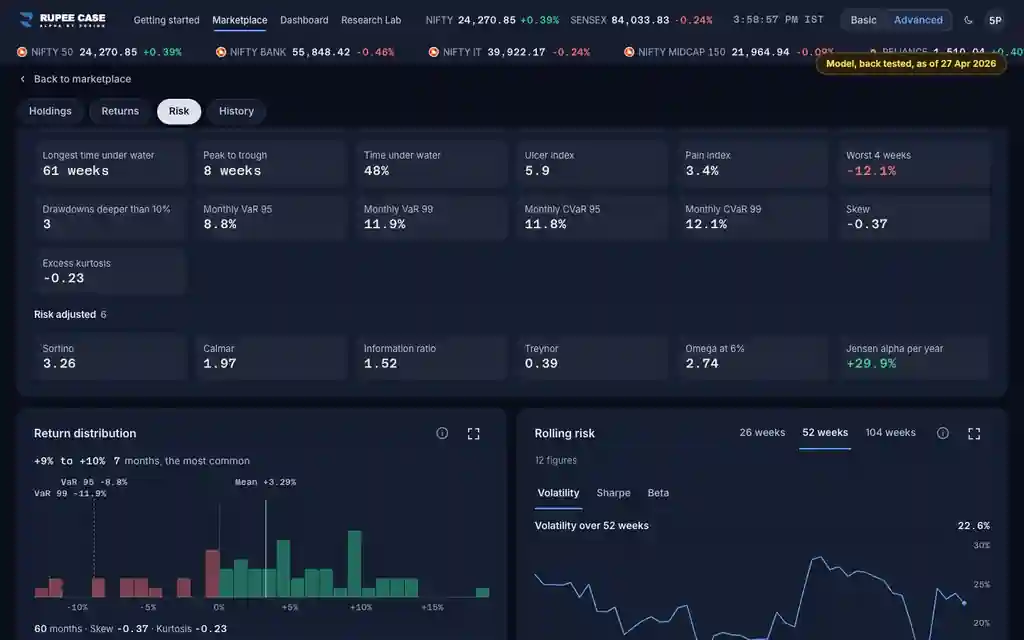
Where it is
ScreenRisk tab, Market link and DiversificationAdvanced
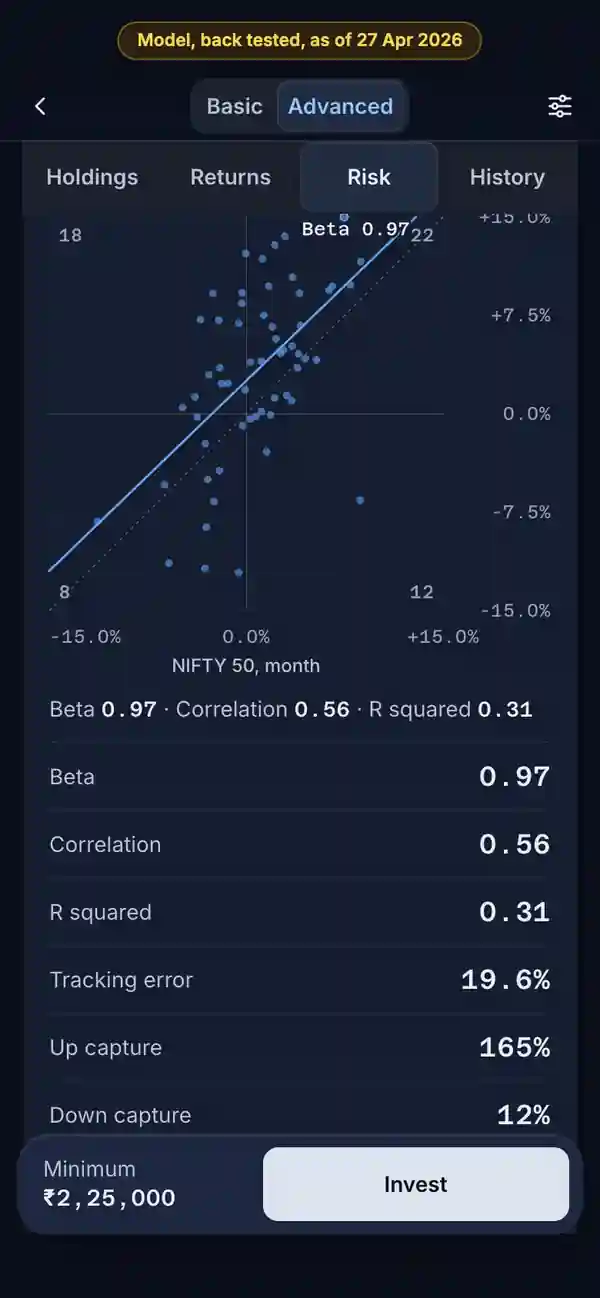
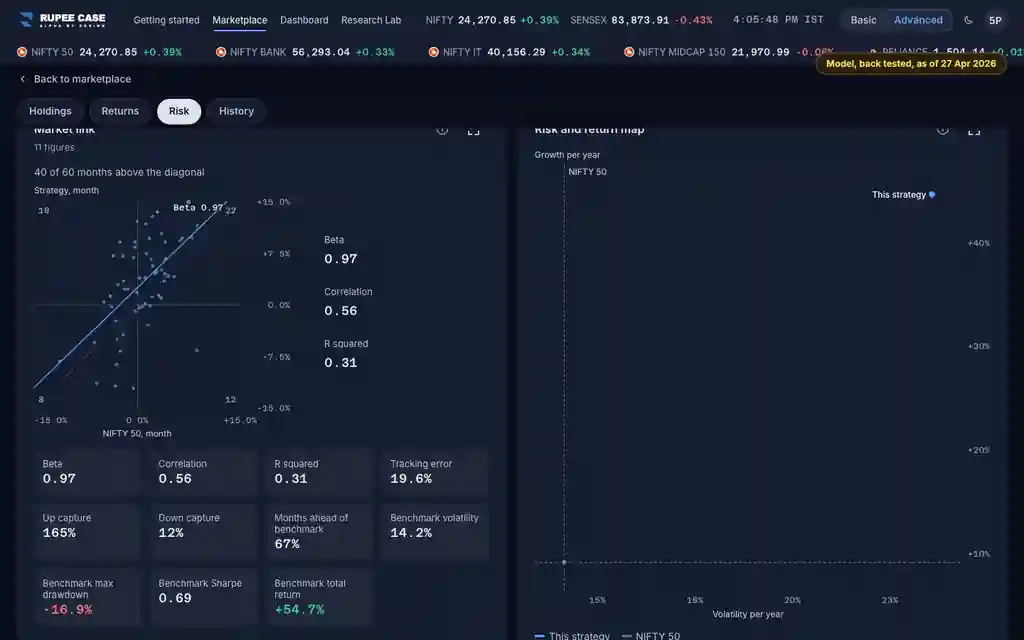
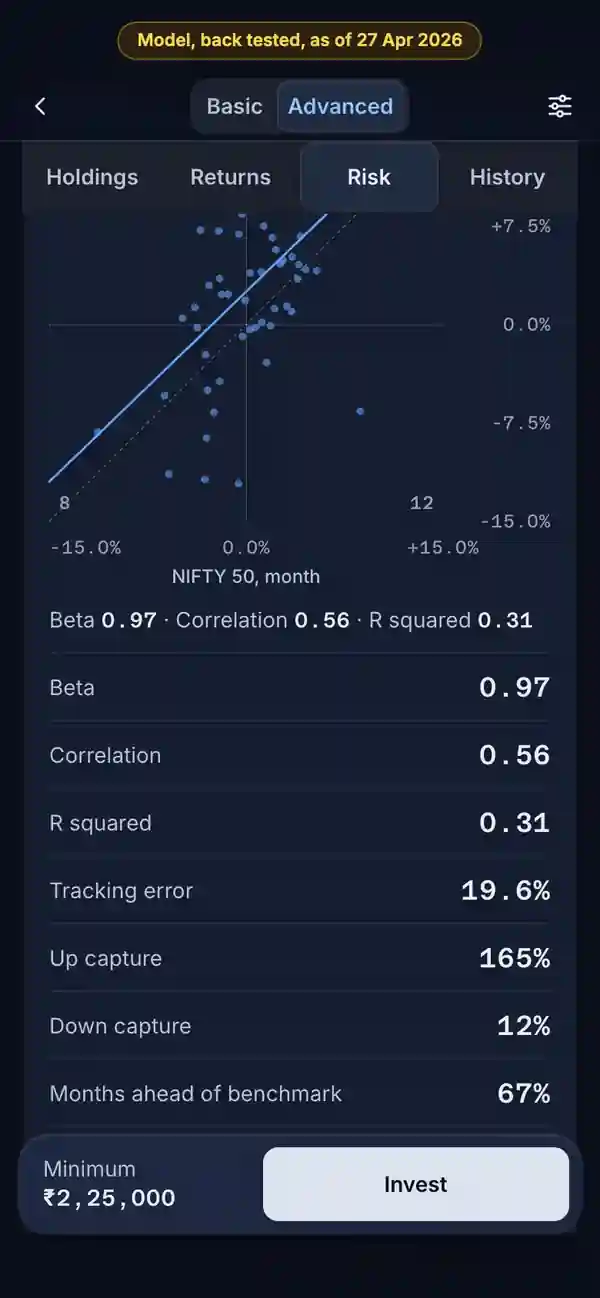
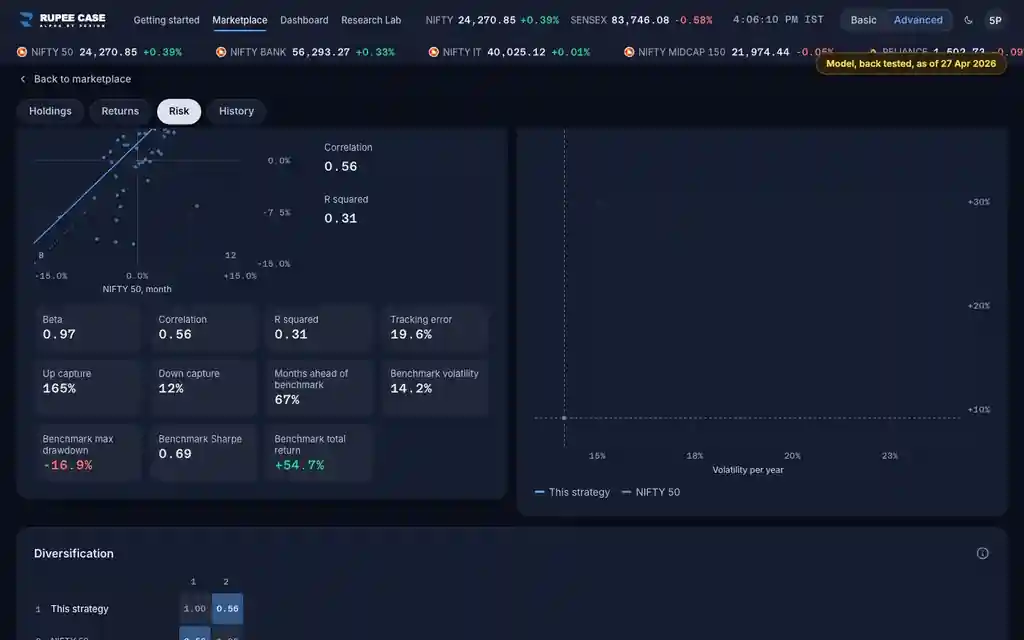
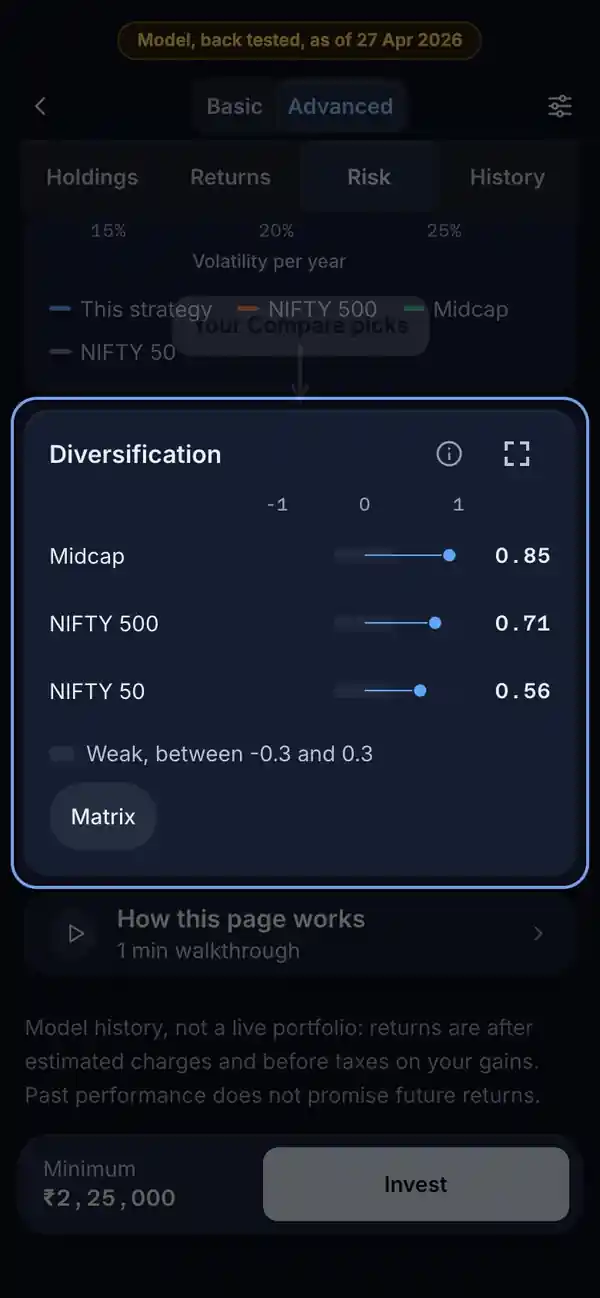
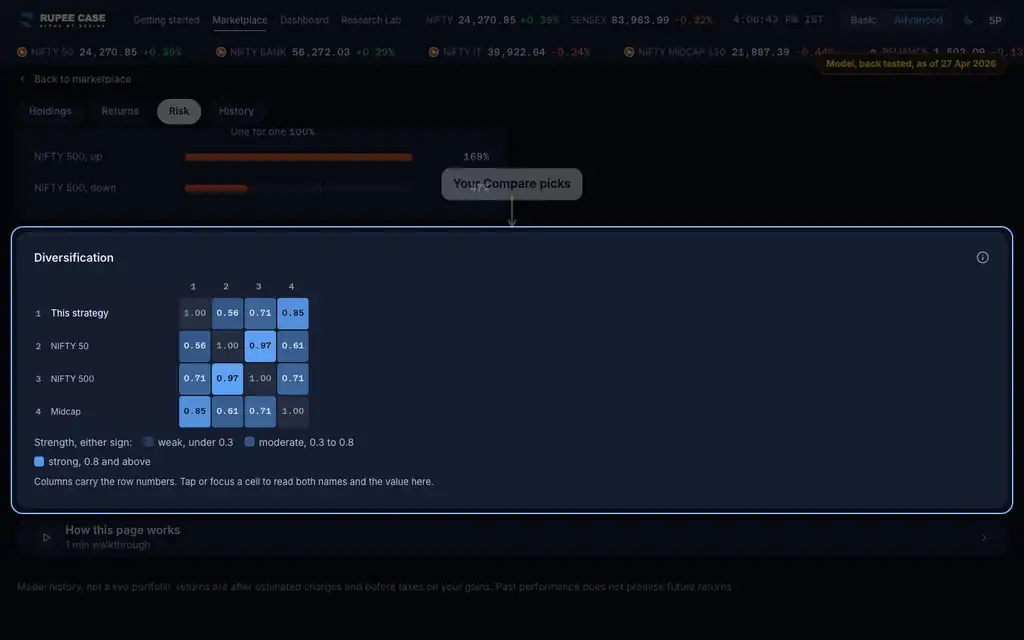
The Risk tab, in Advanced: Market link (Correlation and R squared against the primary benchmark) and Diversification (this strategy, its benchmark and each Compare pick; a track on a phone, a matrix on a wider screen).
Index in this video: Allcap (strategy page).
What it means
Correlation runs from -1 to 1. Near 1 the weekly returns rose and fell together, near 0 there was little link, and below 0 they tended to move opposite ways. R squared is correlation squared: the share of the strategy's weekly swings that line up with the benchmark's. The Diversification card works each pair out on the weeks both lines have and needs 26 common weeks; it calls a link weak under 0.3, moderate to 0.8 and strong from 0.8, either sign.
The formula
Pearson correlation of weekly returns, on the weeks both lines share; R squared is its square.
Correlation = covariance of weekly returns / (sd x sd), common weeks only
R squared = correlation x correlation
Diversification: each pair needs 26 common weeks, else n/a
Strength by size: under 0.3 weak, 0.3 to 0.8 moderate, 0.8 and above strong
Worked example
Example only
- Correlation 0.6 with NIFTY 50
- R squared 0.6 x 0.6 = 0.36
- About a third of the weekly swings line up with the index
How to read it
- High correlation with your other picks: they tended to move together.
- A negative correlation is not a loss: the two tended to move opposite ways.
- Add an index, fund or strategy with Compare to see it in the card.
Watch out
- Correlation says nothing about size: a line can be highly correlated and still move less.
- It describes past weeks; links between markets change over time.
- This recording reads month end history, so its pairs are months.
Transcript
Tap Sound on for voice and music. These are the captions of the video, chapter by chapter.
- 0:00Where it is. In Advanced, Market link sets the strategy against its benchmark.
- 0:09What it means. Correlation: how closely the weekly returns moved together.
- 0:27Worked example. Worked example, example only: Correlation 0.6 with NIFTY 50. R squared 0.6 x 0.6 = 0.36. About a third of the weekly swings line up with the index.
- 0:33How to read it. Diversification pairs the strategy with its benchmark and your picks.
- 0:46Watch out. Watch out: Correlation says nothing about size: a line can be highly correlated and still move less. It describes past weeks; links between markets change over time. This recording reads month end history, so its pairs are months.
Terms in this tutorial
- correlationStatistical measure of how two assets move together.
- R squaredThe share of a strategy's week to week moves that the benchmark explains, from 0 to 1.
- diversificationSpreading capital across assets that do not move together.
- betaSensitivity of a portfolio to the market.