




Most people start with the fun question: which strategy? The order that works is the boring one. Sort money by when you need it, split it between equity, debt and gold, and only then look at what sits inside each part. A good strategy in the wrong place in that order still ends badly. This is education, not advice for your money.
- Emergency fundMonths of essential costs, reachable in a day.
- CoverHealth and term cover, so a bill never forces a sale.
- Goals by dateEach goal gets an amount in today's rupees and a year.
- The mixEquity, debt and gold sized to the fall you can hold.
- RebalanceA written date or band, followed on the bad days.
The order I follow. Strategies come in at step 4, not step 1.
3By the end you can
- Put money in order: emergency fund, cover, goals by date, then the equity, debt and gold mix.
- Estimate what a bad year would do to a mix, in rupees, from the teaching assumption.
- Say what a riskometer step and a tier on RupeeCase tell you, and what they do not.
The emergency fund comes first
An emergency fund is not an investment. It stops a job loss or a hospital bill from becoming a forced sale of equity at the worst price. Count only costs that continue if income stops: rent, EMIs, premiums, groceries, school fees. A common rule of thumb is 3 to 6 months of them for a steady salary, more with variable income or dependants.
The term this section turns on: Emergency fund
The test: if your next 6 months of income stopped tomorrow, which money would you sell first? If the honest answer is your equity, the allocation is already wrong, whatever the strategy.
Read one more paragraph, 93 words
Keep it where you can reach it in a day or two with almost no risk of a fall: a savings account, a sweep deposit or a liquid fund. NISM's mutual fund distributor syllabus (Series V-A) covers risk profiling and asset allocation in its first unit: the plan starts with the person, not the product. RupeeCase's risk profile agrees. It takes 6 points off your final score if you have no emergency fund, and it stops the report altogether if the money is needed within a year or comes from a loan.
Goals and horizons
One percentage for all your money is the usual mistake. A school fee in 18 months and retirement in 25 years cannot share one mix. Write each goal with an amount in today's rupees and a year, and let the year decide how much equity it can carry. Allow for inflation: India's inflation target for the RBI is 4% CPI within a band of 2% to 6%, which the Central Government renewed on 25 Mar 2026 for 1 Apr 2026 to 31 Mar 2031. At 6% a year, prices double in about 12 years.
| Money for | Equity ceiling in the calculator | Where it tends to sit |
|---|---|---|
| Emergency fund, bills due within a year | None, outside equity | Savings account, sweep deposit, liquid fund |
| A goal 1 to under 3 years away | 20% | Deposits and short debt funds |
| 3 to under 5 years | 40% | Mostly debt, some equity |
| 5 to under 7 years | 60% | A mix that moves towards debt as the date nears |
| 7 years or more | Up to 90% | Mostly equity, with debt and gold to steady it |
Ceilings from the Learn asset allocation calculator. In retirement the horizon flips: spending has to last decades, so some equity stays while two or three years of spending sit in debt.
Read 2 more paragraphs, 61 words
RupeeCase's asset allocation calculator uses ceilings by horizon. They are teaching numbers, not a recommendation for you:
The seven goal calculators on Learn tools turn each goal into rupees: goal planner, retirement planner, SWP, FIRE, emergency fund, real return and inflation. The asset allocation calculator then works backwards from the fall you could sit through.
Equity, debt and gold: what each does
Equity drives long run growth and takes the deep falls. Debt steadies the ride and pays for the next few years. Gold pays nothing but has often moved differently from shares. Here is one recent window.
- Nifty 50 price index−8.54%
- Nifty 1D Rate Index3.41%
- Nifty 10 yr G-Sec index1.88%
- Listed gold ETF13.86%
Change from the close of 2 Jan 2026 to the close of 31 Aug 2026: Nifty 50 26,328.55 to 24,080.40; G-Sec index 2,612.28 to 2,661.42; 1D Rate Index 2,511.78 to 2,597.34; gold ETF price 111.82 to 127.32. NSE closes. Price index excludes dividends. One window, not a rule.
Allcap (all equity), TotalMarket Hybrid (20% debt) and Allcap Multi Asset (10% debt, 10% gold) rebased to 100: the three lines run close together. Deepest model falls: Allcap −22.72%, TotalMarket Hybrid −21.82%, Allcap Multi Asset −21.32%.

Read 4 more paragraphs, 171 words
A 60% equity, 30% debt, 10% gold mix, with the 10 year G-Sec index as the debt, would have shown about −3.2% over those same dates, against −8.5% for equity alone. That is arithmetic on the closes, with no rebalancing or costs. In the 2020 crash, from 14 Jan to 23 Mar, the Nifty 50 fell 38.44% (12,362.30 to 7,610.25) while the 10 year G-Sec index rose 3.27%; a 60/40 mix of the two would have shown about −21.8%.
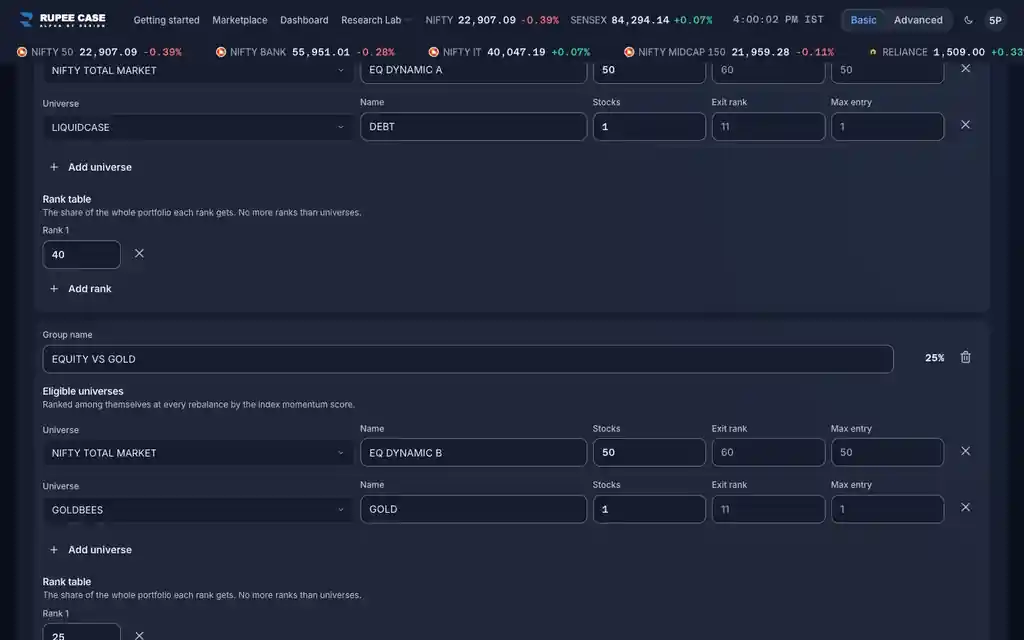
Inside RupeeCase, one 50 stock momentum rule runs as pure equity, with 20% debt, and with 10% debt and 10% gold.
The sleeves took only 0.9 to 1.4 points off the deepest model fall, as of 27 Apr 2026. A small slice inside one rule is a small lever. The big lever is how much of your whole portfolio sits in equity.
If that rupee figure would make you sell, the equity share is above the fall you can hold, and a falling market is the worst place to find that out.
Core and satellite, and the RupeeCase tiers
A core holding carries most of the money and is held through cycles. A satellite is a smaller, focused holding around it. RupeeCase groups its 18 strategies into six tiers by the job they could do. A tier is a label set for each strategy, not a computed figure; it shows above the strategy name and in the marketplace filter.
| Tier | Strategies | The job, as the tier page words it |
|---|---|---|
| Starter | 2 | A first strategy with a low minimum capital |
| Conservative core | 3 | Capital you want invested through cycles, from the largecap universe |
| Growth core | 5 | Growth capital that can sit through deeper falls, across mid, small and micro caps |
| Multi asset core | 5 | An equity engine wrapped in debt or gold sleeves |
| Full equity core | 1 | Full equity swings, the broadest universe, no debt cushion |
| Thematic satellite | 2 | A small slice with a directional view on one sector |
RupeeCase strategies by tier, as published on the tier pages. Minimums run from ₹22,000 to ₹4,75,912, as of 8 Aug 2026; they move with share prices.
- Thematic satellite−39.48%
- Growth core−26.43%
- Starter−24.18%
- Conservative core−23.56%
- Full equity core−22.72%
- Multi asset core−21.82%
Deepest model fall of the worst strategy in each tier. Model, back tested. As of 27 Apr 2026, from the RupeeCase lineup. Not a promise of future returns; the next fall can be deeper.
Strategies: the largest is Growth core at 5
Read one more paragraph, 43 words
The two thematic baskets sit at the top because ten stocks in one sector cannot cushion each other. That is why a satellite stays small: a 39% fall on a small slice can be held, on a large one it often is not.
What the riskometer bands mean
SEBI requires every mutual fund scheme to carry a riskometer with six levels: Low, Low to Moderate, Moderate, Moderately High, High and Very High. RupeeCase draws the same six steps on each strategy. It is a RupeeCase label, not a SEBI rating.
MythA conservative tier or a low riskometer band means the strategy cannot fall much.
FactThe three Conservative core strategies sit in Moderately High and fell 21% to 24% in the model. The band is a design label; the fall is history, and the next one can be deeper.
Read 2 more paragraphs, 156 words
A fixed rule strategy earns points for a wide universe, few stocks, a past return that strayed far from the benchmark's before charges, and a single asset class. More points, higher step. Strategies that move money between sleeves by rule start at Moderately High, and a level can be set by hand. Of the 18, 5 are Moderate, 9 Moderately High, 3 High and 1 Very High. None sits below Moderate, so low risk money is not on the marketplace.
Two limits. A band says how the strategy is built, not how deep the next fall is, and it says nothing about you. That is the job of the risk profile: 28 questions, a capacity score out of 50 (what you can afford to lose) and a tolerance score out of 50 (what you can stand to watch). The lower score counts, and it gives one of five bands, from Very Conservative (Low) to Aggressive (High).
Rebalancing the mix
A mix drifts. After a strong year for equity, a 60/40 portfolio is quietly 65/35, and you carry more risk than you chose. Module 4.3 covers calendar and band rules. For a personal equity, debt and gold mix, a yearly date, or a band of about 5 points around each target, is common. The drift calculator checks a holding against its band.
- New money first. Put fresh savings into the underweight part. No sale, no tax.
- Every sale has a clock. Listed equity sold within 12 months is taxed at 20%; after that, 12.5% above ₹1.25 lakh a year. A listed gold ETF held over 12 months is also 12.5%. Debt fund units bought on or after 1 April 2023 are taxed at your slab rate however long you hold them. From 1 April 2026 these rules sit in the Income-tax Act, 2025 (sections 196 and 198 for listed equity), at the same rates.
- Rebalance the uncomfortable way. After a fall the rule says buy equity. After a rally it says trim. Both feel wrong, which is why you write the rule down first.
Common mistake: setting the mix after a good year
After a strong run, every investor feels long term and raises equity. The share chosen then is the one that hurts in the next fall. The second mistake is counting only your fund statement. EPF, PPF and deposits are debt: ₹15 lakh in EPF and ₹5 lakh in equity funds is 25% equity, not 100%. Count everything first.
How this shows up in RupeeCase
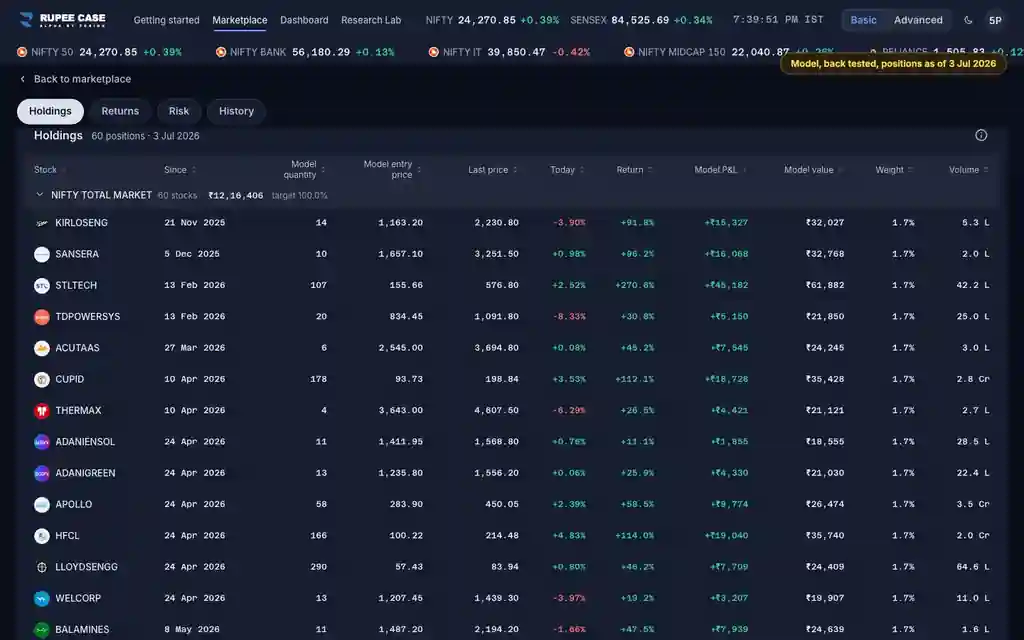
Every strategy carries a riskometer step and a tier, and both are marketplace filters. The risk profile scores your capacity and tolerance and lists the strategies within your band. The tier pages, such as Conservative core and Thematic satellite, show each group side by side, and compare sets up to four strategies against each other. Each portfolio rebalances on its own strategy's dates; the app does not move money between your strategies or your other holdings, so that split is yours to check, for example once a year. Allcap Multi Asset and Dynamic Asset Allocator carry their own debt and gold sleeves. Money you top up buys more of the current holdings, which restores a drifted mix without a sale.
The app tutorials Marketplace chips: what do New, Partner and the themes mean?, Filters, sort and shortlist, Minimum investment: why does each strategy have one? and Combine portfolios show where tiers, bands and minimums sit, and how to tidy two portfolios on one strategy.
Two terms to hold on to from 4.6
Key takeaways
- An emergency fund comes before any strategy; it stops a forced sale at the worst price.
- Each goal gets an amount and a year, and the year sets how much equity it can carry.
- The share of equity in the whole portfolio is the big lever; a small debt sleeve inside one rule moved the model fall by about a point.
- On the teaching assumption, 50% equity, 10% gold and 40% debt falls about 29.5% in a bad year.
- A riskometer step describes how a strategy is built, not how deep its next fall is or what suits you.
- Count EPF, PPF and deposits as debt before you judge your equity share.
Questions readers ask
Is the 100 minus age rule a good asset allocation?
It captures one true idea, that time to recover shrinks with age, and ignores when each goal is due, how steady your income is and what you hold in EPF and deposits. Treat it as a first guess and test the result in rupees.
Does a higher riskometer band mean a better strategy?
No. A higher band means more points of risk in how the strategy is built, not more return. Dynamic Asset Allocator sits at Moderately High while its deepest model fall is the shallowest on the lineup, as of 27 Apr 2026.
How often should the mix be rebalanced?
Once a year, or when a weight leaves a band of about 5 points, is common for a mix you manage yourself. Directing new money to the underweight part first avoids a taxable sale. The rule you follow matters more than the interval.
Rules and figures in this module were last verified on 19 Oct 2026. Tax and regulatory rules change; check the source before acting.