




Why a return needs a risk ratio
A yearly return of 14% says nothing about how the money got there. One portfolio may have climbed steadily; another may have fallen by a third and then recovered. Two investors with the same final number lived through very different years, and one of them may have sold at the bottom.
Read one more paragraph, 61 words
Risk adjusted ratios put the return and the risk on one scale. Each divides some measure of reward by some measure of pain. They differ in what they count as pain: all volatility, only the bad volatility, or the worst fall. The risk metrics module covers volatility and drawdown on their own; this guide puts the three ratios side by side.
₹100 in Allcap Multi Asset became about ₹598 in the model
What is the Sharpe ratio?
William F. Sharpe introduced the measure in 1966 as the "reward to variability" ratio, and restated it in 1994 in the form most factsheets use today:
- Rp
- Rf
- σp
Read 3 more paragraphs and a list, 160 words
Sharpe ratio = (Rp − Rf) ÷ σp
- Rp is the portfolio's return over the period, usually annualised.
- Rf is the risk free rate for the same period, typically a short term government or money market rate. A factsheet footnote names the rate it used.
- σp is the standard deviation of the portfolio's returns, annualised. For monthly returns, the usual convention multiplies the monthly standard deviation by the square root of 12.
The numerator is the extra return earned for taking risk at all. The denominator is how much the returns swung around their own average. A higher Sharpe means more excess return per unit of swing.
The Sharpe ratio is the most common of the three because the inputs are easy to compute and it fits portfolio theory neatly. Its weakness is in the denominator: standard deviation counts a month of +8% as just as risky as a month of −8%. For an investor, those two months do not feel the same.
What is the Sortino ratio?
Frank Sortino and Lee Price set out the downside risk framework in 1994. The ratio keeps Sharpe's idea but changes the denominator:
- T
- DD
Read 2 more paragraphs and a list, 96 words
Sortino ratio = (Rp − T) ÷ DD
- T is a target or minimum acceptable return. Many calculators set it to the risk free rate; others use zero. Whichever is used, it has to be stated.
- DD is the downside deviation: the square root of the average of the squared shortfalls below the target, where any period at or above the target counts as zero.
So a portfolio that swings a lot on the way up but rarely falls below the target gets a much better Sortino than Sharpe. A portfolio whose swings are mostly downward gets little benefit.
A small downside deviation example
Take six made up monthly returns, for illustration only: +4%, −3%, +2%, −5%, +6% and +2%. Set the target at 0%.
| Month (illustration) | Return | Shortfall below 0% | Shortfall squared |
|---|---|---|---|
| 1 | +4% | 0 | 0 |
| 2 | −3% | −3 | 9 |
| 3 | +2% | 0 | 0 |
| 4 | −5% | −5 | 25 |
| 5 | +6% | 0 | 0 |
| 6 | +2% | 0 | 0 |
Read one more paragraph, 62 words
The squared shortfalls add up to 34. Divided by all six months, that is 5.67, and its square root is about 2.38%: the monthly downside deviation. The ordinary standard deviation of the same six months is about 4.2%, because it also counts the +6% and +4% months as swings. The upside months raise the Sharpe denominator but leave the Sortino denominator alone.
Allcap Multi Asset fell at most 20.7% below its model high, month end to month end
What is the Calmar ratio?
Terry Young described the Calmar ratio in 1991, in the managed futures industry. It replaces volatility with the single deepest fall:
Read 3 more paragraphs, 117 words
Calmar ratio = compound annual return ÷ maximum drawdown
The maximum drawdown is the largest fall from any peak to a later low, written as a positive number. Young's original version used the last 36 months of monthly data; many tools now apply the same formula to the whole record, which changes the result, so the window has to be stated.
The Calmar ratio has the most direct reading of the three. A Calmar of 0.5 means the portfolio's worst fall was twice its yearly return: two years of typical gains lost in one episode. It is also the ratio closest to how investors experience risk, because the deepest fall is the moment most people are tempted to sell.
The worked example: two portfolios, three rankings
Here are two made up portfolios, for illustration only. The numbers are chosen to show how the ratios disagree; they are not the record of any fund, index or strategy, and the 6% risk free rate is an assumption, not a published rate.
| Illustration, made up | Portfolio A | Portfolio B |
|---|---|---|
| Yearly return | 14% | 12% |
| Risk free rate (assumed) | 6% | 6% |
| Volatility (standard deviation) | 18% | 12% |
| Downside deviation (target 6%) | 11% | 9% |
| Maximum drawdown | 28% | 15% |
| Sharpe: (return − 6%) ÷ volatility | 0.44 | 0.50 |
| Sortino: (return − 6%) ÷ downside deviation | 0.73 | 0.67 |
| Calmar: return ÷ maximum drawdown | 0.50 | 0.80 |
- Sharpe, A0.44
- Sharpe, B0.50
- Sortino, A0.73
- Sortino, B0.67
- Calmar, A0.50
- Calmar, B0.80
Made up numbers from the table above, for illustration only. The higher value in each pair is marked.
- Sharpe
- Sortino
- Calmar
Read 2 more paragraphs and a list, 123 words
Read it ratio by ratio:
- Sharpe prefers B. A earned two points more, but swung half as much again.
- Sortino prefers A. Much of A's extra volatility came from strong up months, which Sortino does not count. Its downside deviation is only two points higher than B's.
- Calmar prefers B by a wide margin. A's worst fall was 28%, almost twice B's, for two extra points of return.
None of these is the right answer on its own. An investor who cares most about the worst moment would weigh Calmar; one who accepts deep falls but dislikes frequent small losses might weigh Sortino. What the example shows is that a single ratio, quoted alone, hides a choice about which kind of risk matters.
What each ratio misses
Every ratio compresses a whole record into one number, and each one drops something different.
The Sharpe ratio
- It penalises good surprises
- It assumes the swings are well behaved
- Smoothed prices flatter it
- The inputs move it
Read a list, 114 words
- It penalises good surprises. Standard deviation counts upside swings as risk, so a strategy with occasional large gains can look worse than it was.
- It assumes the swings are well behaved. Returns with rare, very large losses can show a high Sharpe for years before the loss arrives. Strategies that sell options or hold hard to price assets are the usual examples.
- Smoothed prices flatter it. An asset valued infrequently shows less volatility than it really has, which raises the ratio.
- The inputs move it. The risk free rate chosen, the period and whether returns are daily, weekly or monthly all change the figure. Two Sharpe ratios are comparable only when all three match.
The Sortino ratio
- The target is a choice
- It rests on fewer data points
- It ignores the order of losses
Read a list, 85 words
- The target is a choice. A Sortino with a 0% target and one with a 6% target are different numbers for the same record.
- It rests on fewer data points. Only the periods below the target feed the denominator, so a short record with few bad months gives a noisy estimate.
- It ignores the order of losses. Five small losses spread over five years and five in a row produce the same downside deviation, though the second is a drawdown and the first is not.
The Calmar ratio
- It rests on one event
- It depends on the window
- It ignores recovery time
Read a list, 85 words
- It rests on one event. A single crash sets the denominator. Everything else that happened in the record is ignored.
- It depends on the window. A longer record has more chances to include a deep fall, so Calmar ratios over different lengths are not comparable. A record that happens to start after a crash looks better than it should.
- It ignores recovery time. A fall that recovers in three months and one that takes three years give the same Calmar if they are equally deep.
All three
All three are backward looking and describe one path through one set of dates. They say nothing about what will happen next. They also depend on whether the returns are after costs and whether they are live or back tested; the comparison guide covers those checks.
MythThe portfolio with the highest Sharpe ratio is the least risky one.
FactSharpe measures return per unit of volatility, not the size of the worst fall. In the illustration above, the gap between A and B is small on Sharpe and large on Calmar.
Reading the ratios on a factsheet
Mutual fund factsheets in India usually print the Sharpe ratio next to standard deviation and beta, with a footnote naming the risk free rate and the period. A few steps make the figure usable:
- Check the periodthe ratio is for the stated window only, and comparisons need the same dates.
- Check the ratenote the risk free rate in the footnote; a higher assumed rate lowers every Sharpe.
- Check the frequencydaily, weekly and monthly returns give different annualised figures.
- Add the drawdowncompute or look up the deepest fall and divide the yearly return by it for a Calmar.
- Compare like with likethe same benchmark, after costs, live record against live record or back test against back test.
The factsheet guide shows where each of these sits on a typical factsheet.
How this shows up in RupeeCase
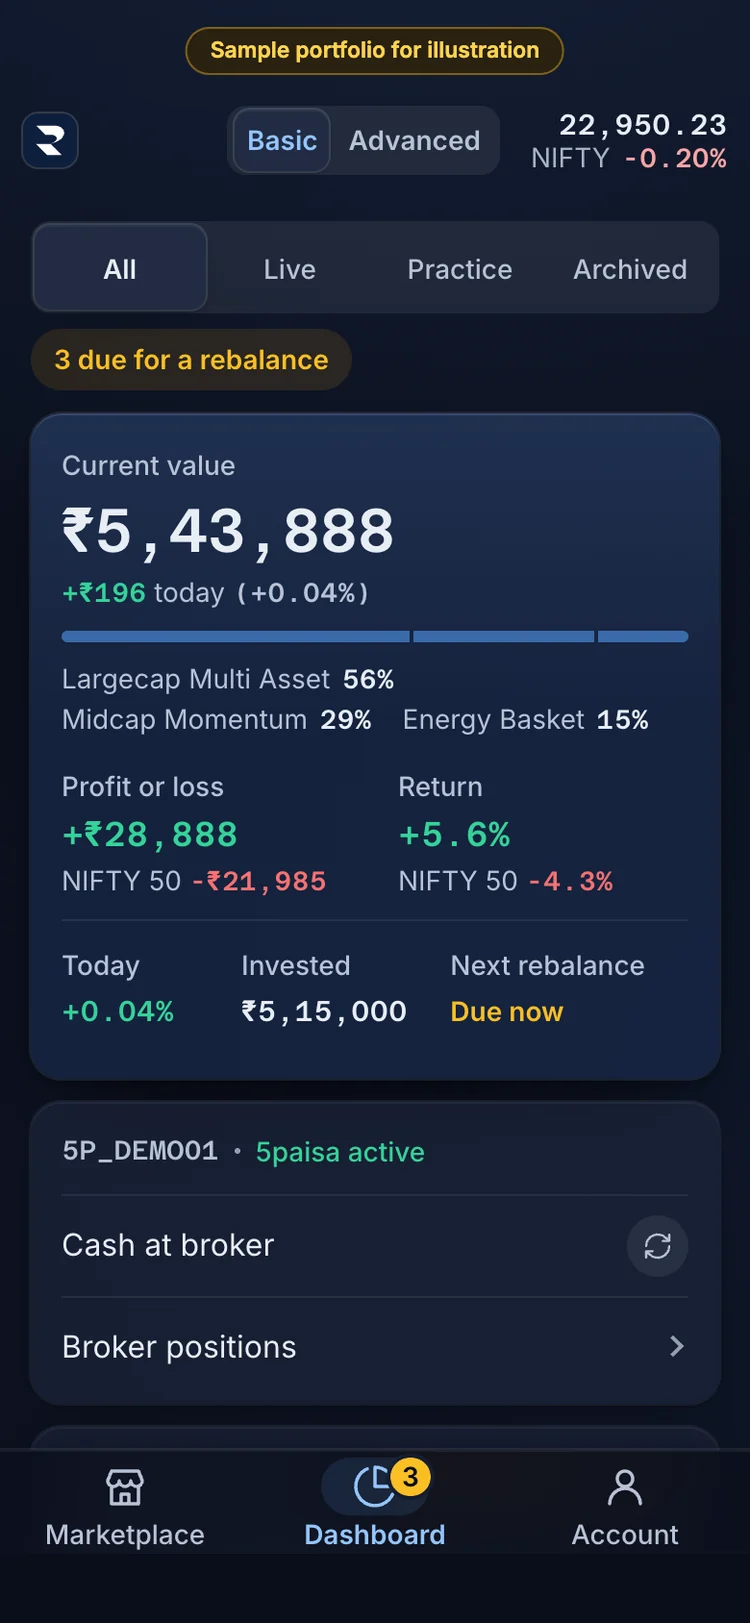
1The Dashboard sums up your portfolios: current value, profit or loss, return and invested. 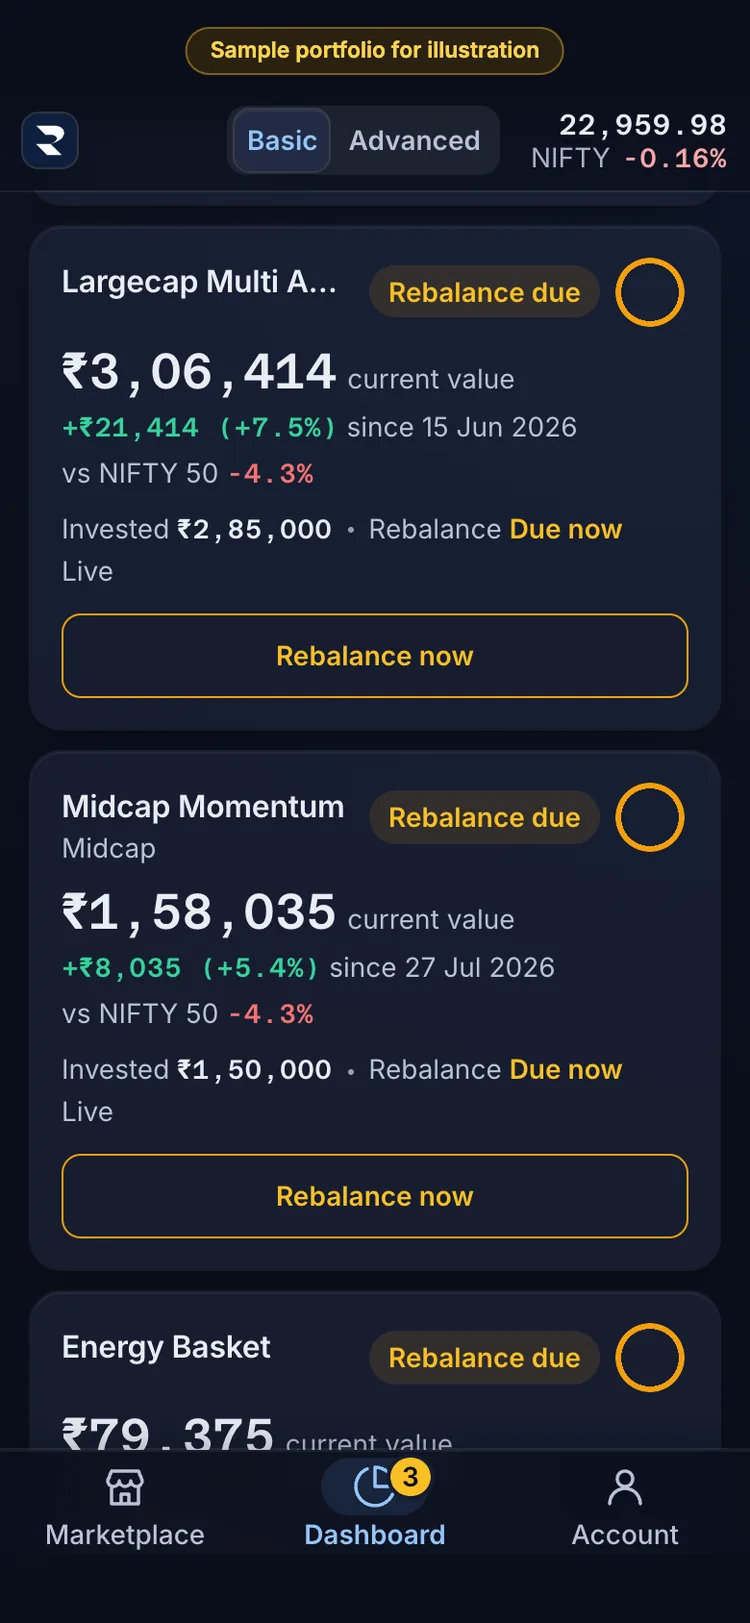
2Each portfolio has a card: current value, the gain since you invested, and the NIFTY 50 beside it. 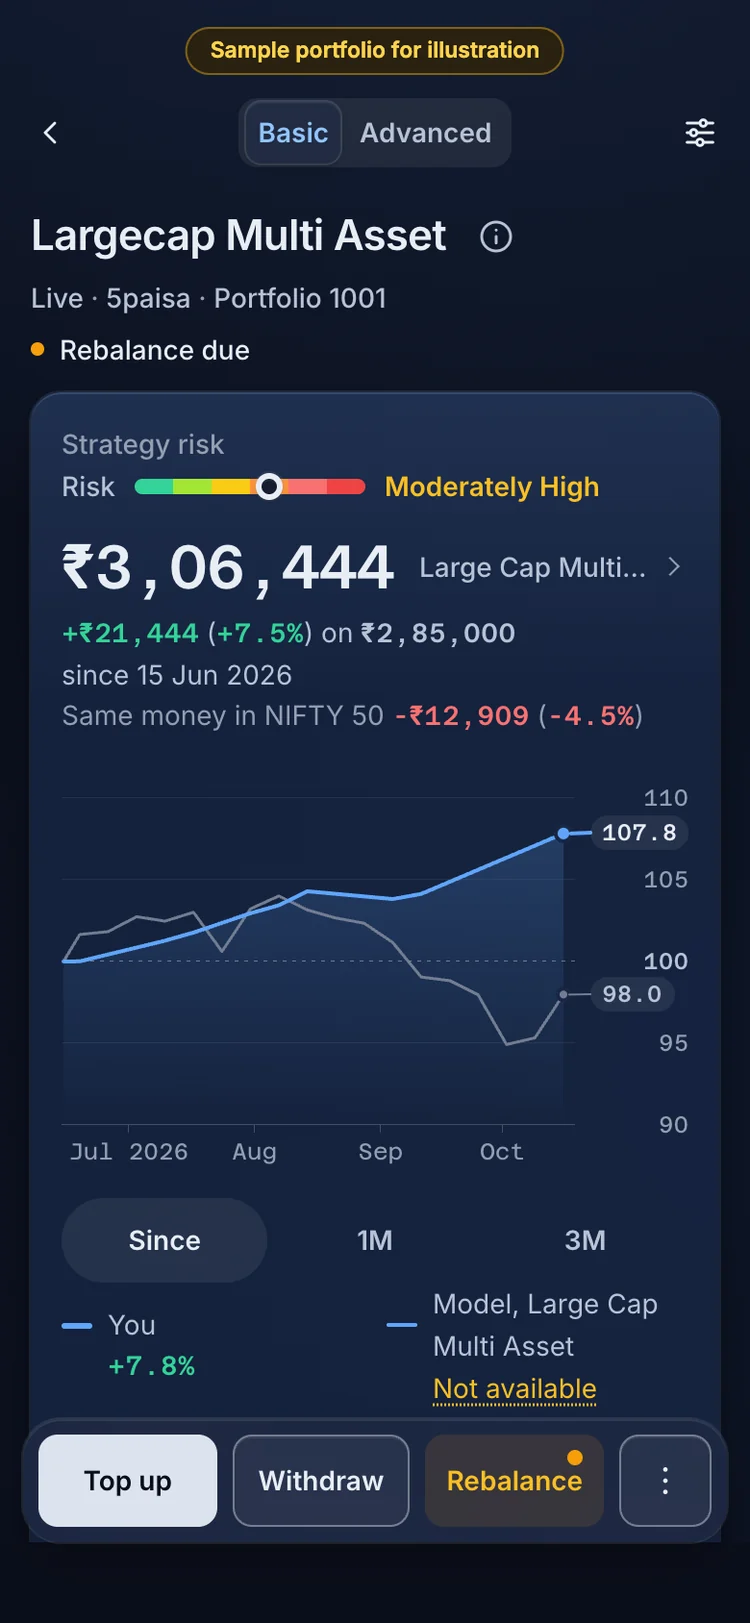
3A portfolio: its value since you invested, and the same money in the NIFTY 50 on your dates. 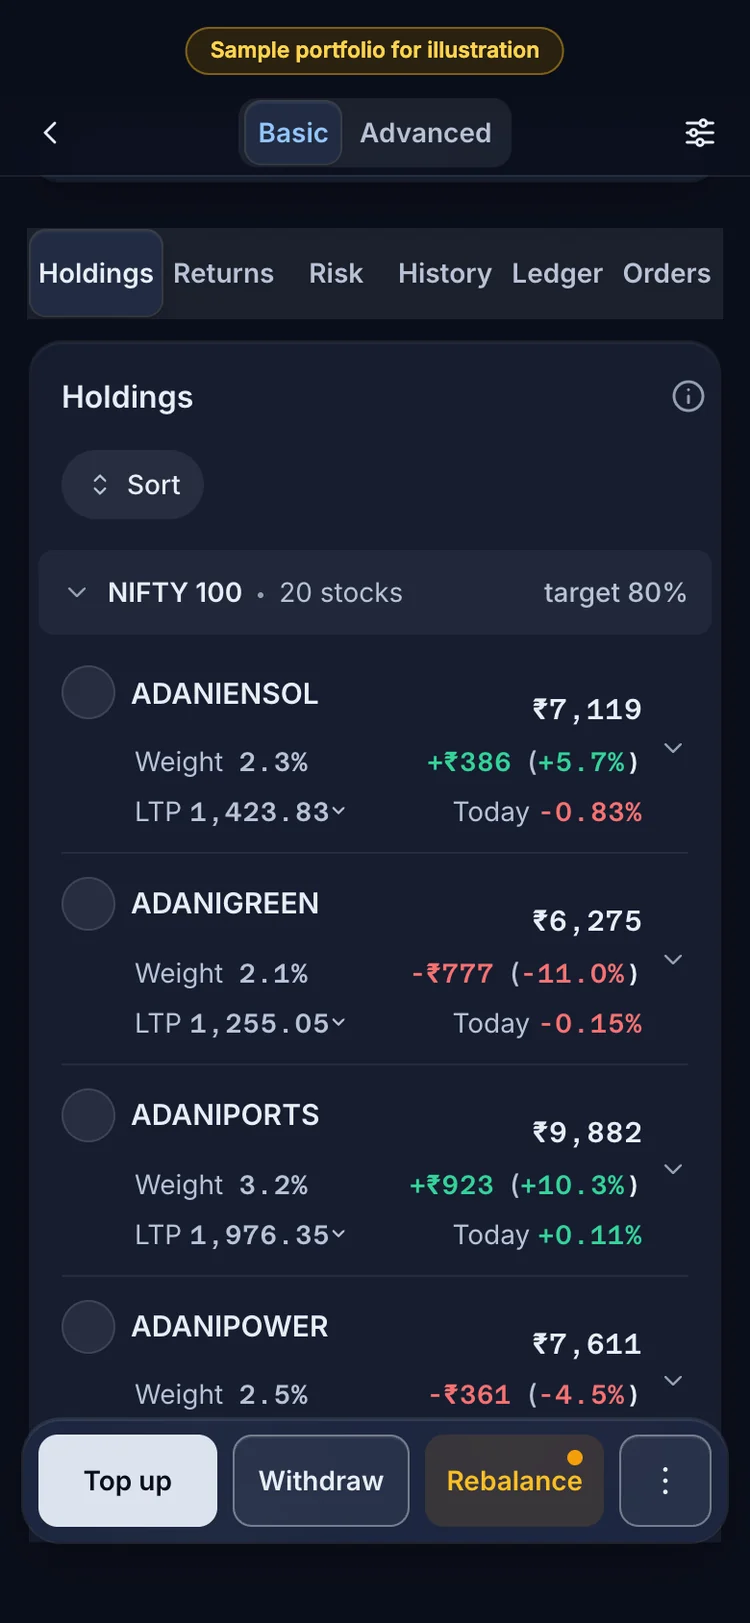
4Holdings: each holding with its value, weight and gain or loss. 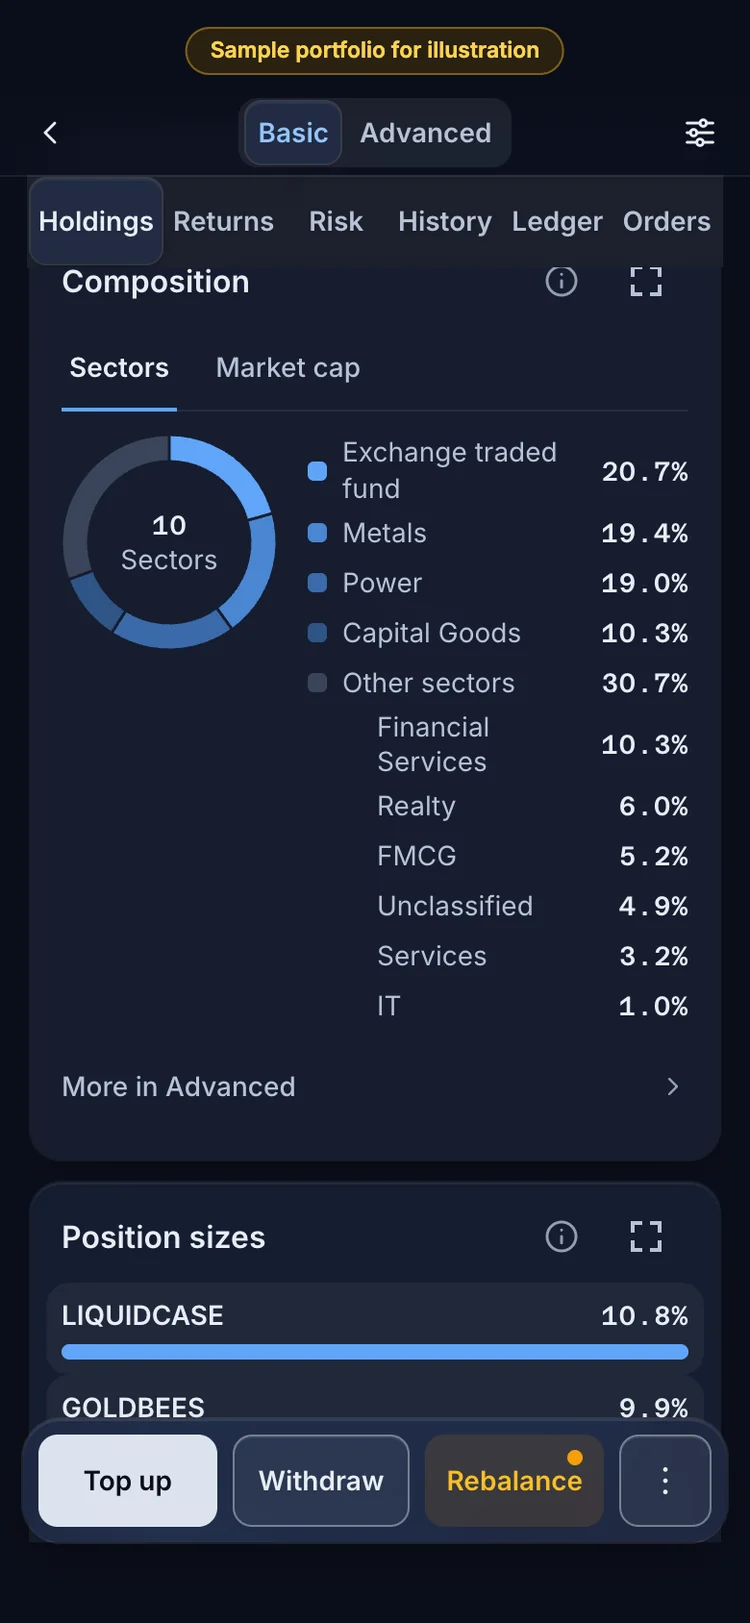
5Composition: what the portfolio owns, by sector and by market cap. 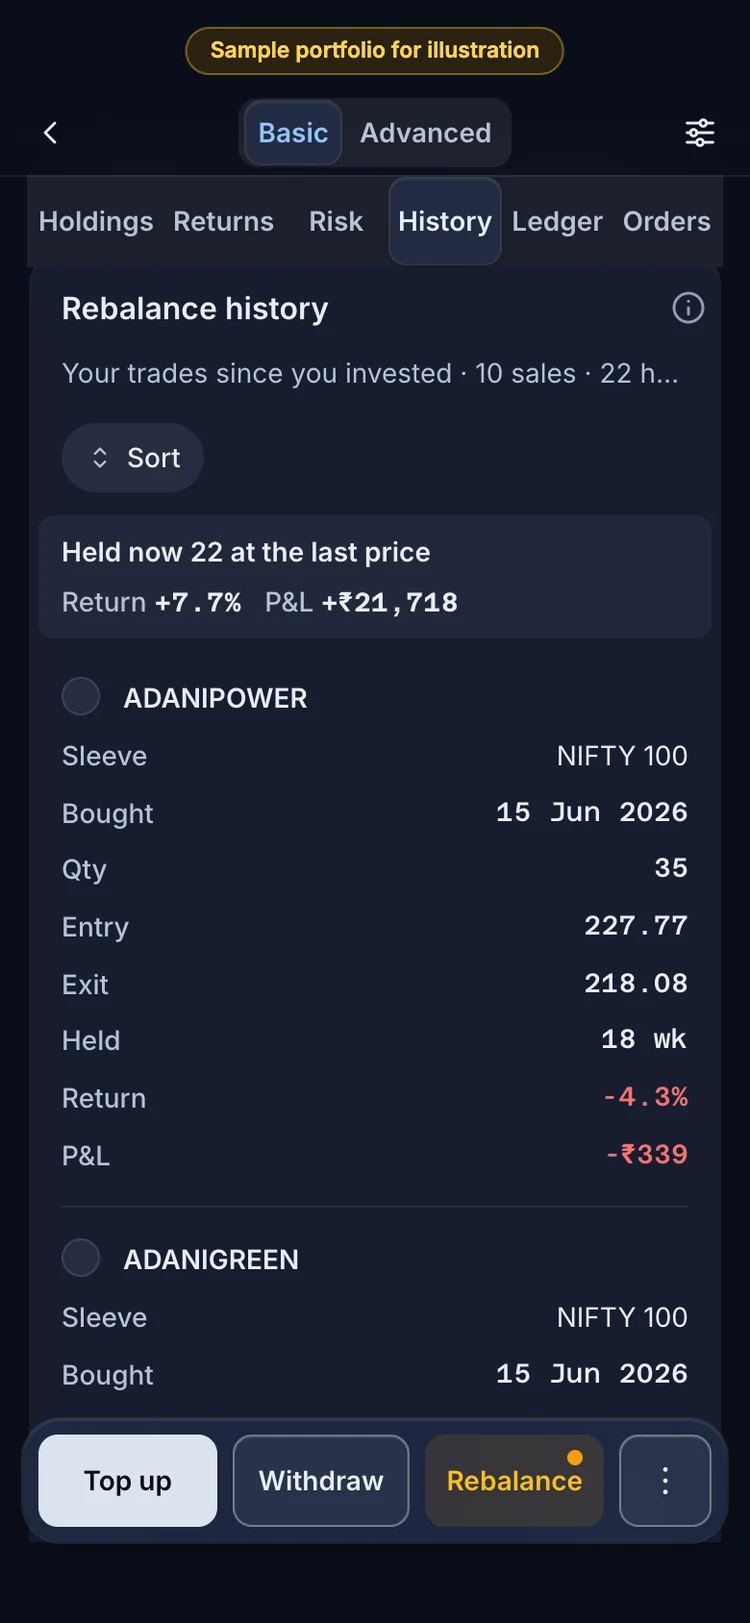
6History: your own trades since you invested, by the rebalance that sold them, and what you hold now. 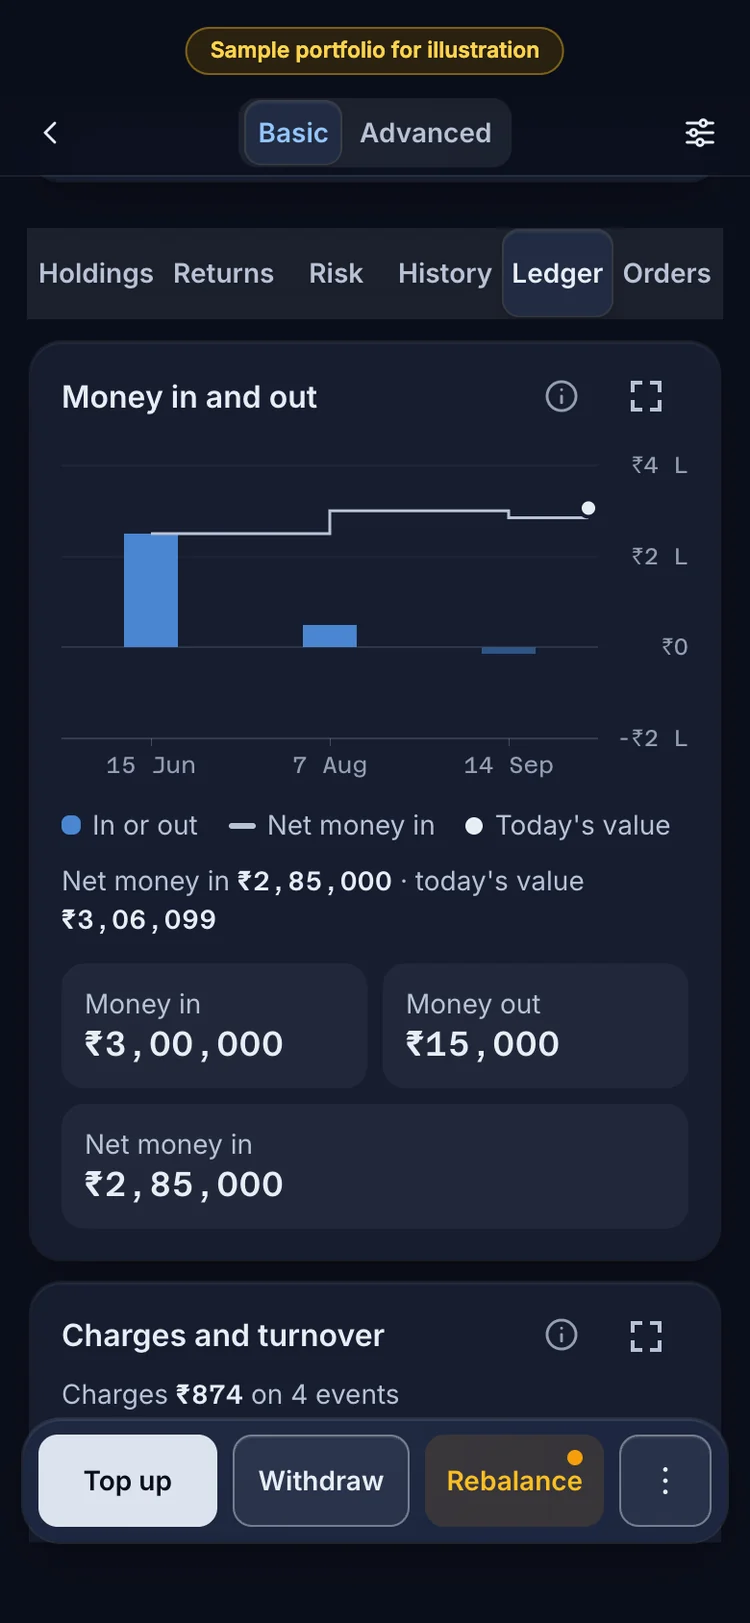
7The Ledger: money in, money out and net invested, then every event with its status.
Where it sits in RupeeCase, in words
Every RupeeCase strategy page shows the model CAGR, the deepest fall and the Sharpe ratio side by side, with the dates they cover. Allcap Multi Asset holds 52 positions across equity, debt and gold, rebalanced every 2 weeks: model CAGR 40.47%, deepest fall −21.32%, Sharpe 1.81, as of 27 Apr 2026. All are model, back tested figures after costs, not client returns. The Sharpe and volatility calculator works out the ratio from your own numbers, and the note Sharpe, Sortino, Calmar: three leaderboards ranks the RupeeCase lineup on each.
Questions investors ask
What is the difference between the Sharpe and Sortino ratios?
Both divide excess return by a measure of risk. Sharpe uses the standard deviation of all returns, so upside swings count as risk. Sortino uses downside deviation, which counts only returns below a target. A portfolio with large up months and few losses scores much better on Sortino.
How is the Calmar ratio calculated?
Divide the compound annual return by the maximum drawdown over the same period, with the drawdown written as a positive number. A 12% yearly return with a 15% deepest fall gives a Calmar of 0.80. The original version used the last 36 months.
What is a good Sharpe ratio?
There is no official threshold. A Sharpe ratio is only meaningful against another one measured over the same dates, with the same risk free rate and return frequency. A figure from a calm period and one from a period with a crash are not comparable.
Can a Sharpe ratio be negative?
Yes. When the portfolio's return is below the risk free rate, the numerator is negative. Ranking negative Sharpe ratios is tricky, because a more volatile portfolio can show a less negative figure.
Which ratio matters most for a long term investor?
It depends on which risk the investor finds hardest to sit through. Calmar speaks to the deepest fall, Sortino to frequent losses and Sharpe to overall bumpiness. Reading all three over the same dates gives a fuller picture than any one.
Do these ratios predict future returns?
No. All three describe a past record over a stated period. A ratio from a back test or a short live record is an estimate with wide error, not a forecast.