
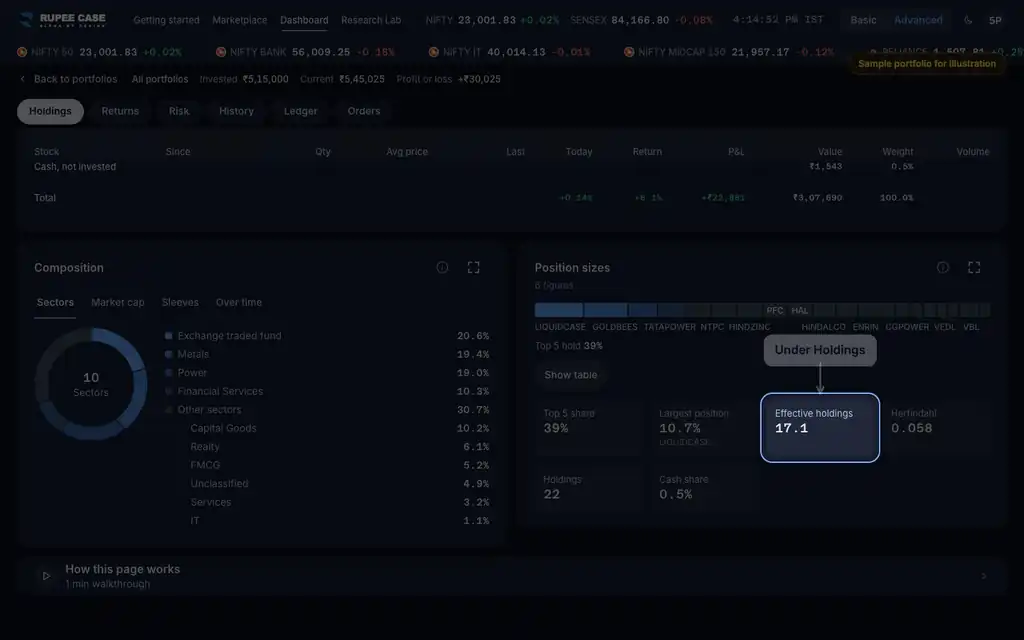
Where it is
ScreenHoldings tab, Position sizesAdvanced
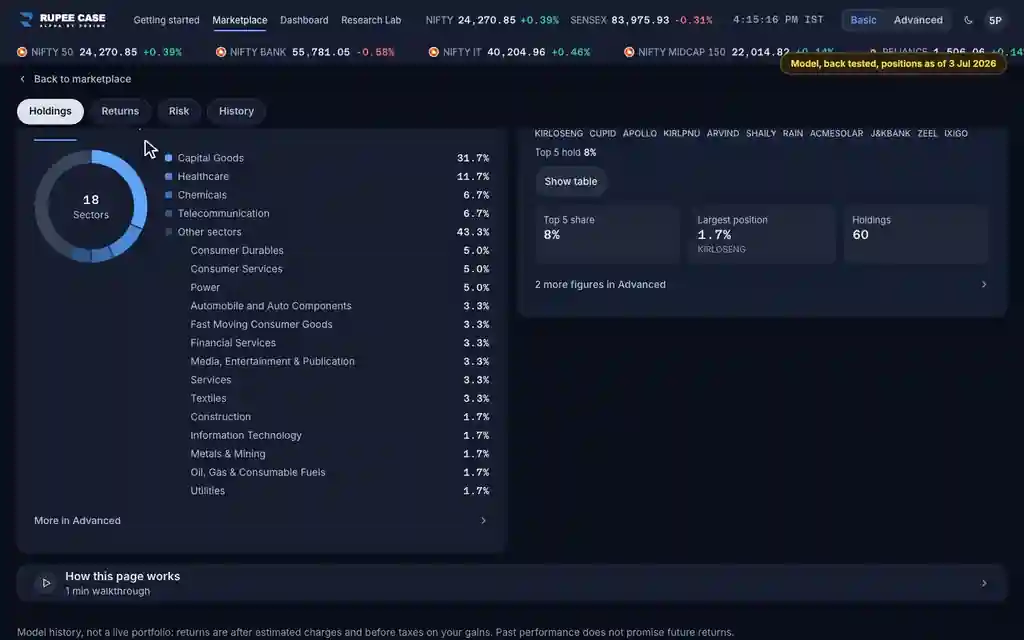
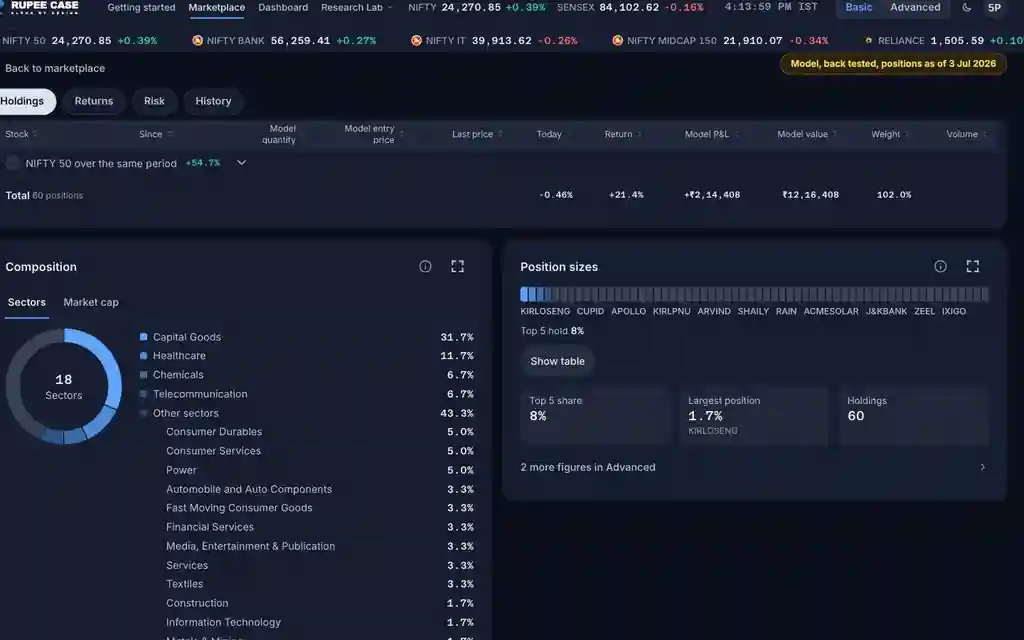
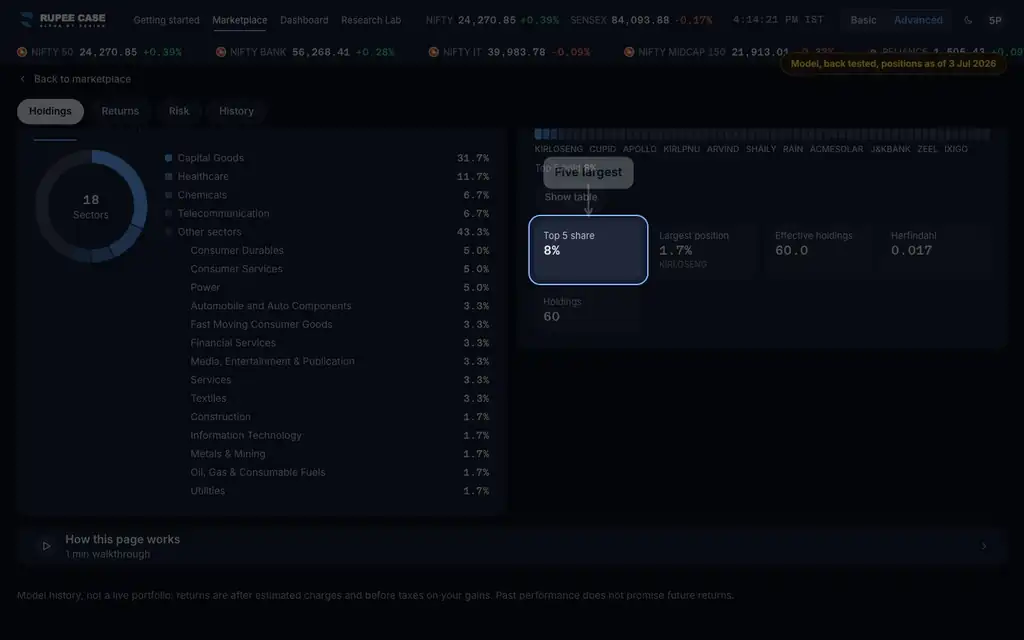
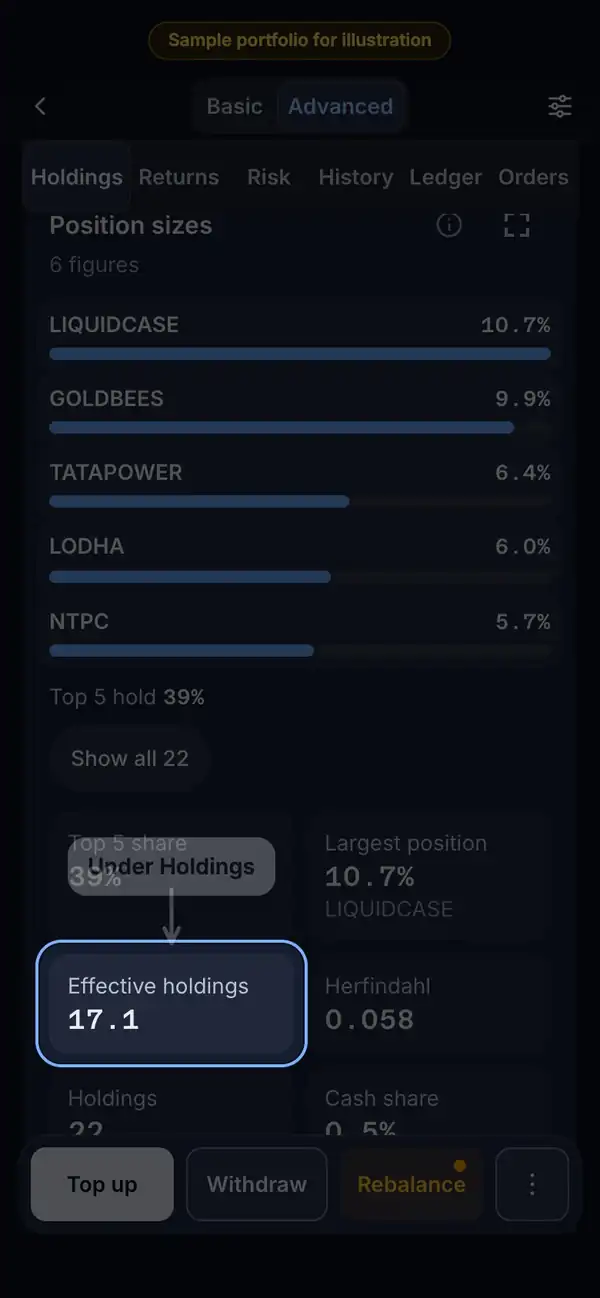
The Holdings tab, Position sizes card. Top 5 share, Largest position and Holdings show in Basic; Effective holdings and Herfindahl in Advanced; Cash share on a portfolio.
Indices in this video: Allcap (strategy page) and Large Cap Multi Asset (the sample portfolio).
What it means
The card measures how much of the money sits in a few names. Top 5 share adds the five largest positions; Largest position names the biggest. Herfindahl adds up every position's share squared: 1 means one position holds everything, and an equal split over N names gives 1 / N. Effective holdings turns it back into a count: the number of equal positions that would be just as concentrated. On a portfolio, Cash share is the cash beside the holdings.
The formula
Square each position's share and add the squares: that is the Herfindahl index. One over it is the effective number of holdings.
Share = position weight / total weight (portfolio: live value / holdings value, cash left out)
Herfindahl = sum of share squared (0 to 1)
Effective holdings = 1 / Herfindahl
Top 5 share = sum of the five largest shares
Cash share = cash / (holdings value + cash), portfolio only
Worked example
Example only
- 4 positions at 25% each: 4 x 0.25 x 0.25 = 0.25, effective 4
- One at 70%, three at 10%: 0.49 + 3 x 0.01 = 0.52
- Effective holdings 1 / 0.52 = 1.9
How to read it
- At equal weights Effective holdings matches Holdings, as on Allcap's 60.
- Effective holdings well under Holdings: a few positions carry most of the money.
- A higher Herfindahl means more concentration.
Watch out
- It counts positions, not how they move together: two similar stocks still count as two.
- On a portfolio the shares leave cash out; Cash share shows it on its own.
- On a multi asset portfolio an ETF can be the largest position.
Transcript
Tap Sound on for voice and music. These are the captions of the video, chapter by chapter.
- 0:00Where it is. Position sizes, on the Holdings tab, shows how spread the money is.
- 0:10What it means. Top 5 share adds up the five largest positions.
- 0:36Worked example. Worked example, example only: 4 positions at 25% each: 4 x 0.25 x 0.25 = 0.25, effective 4. One at 70%, three at 10%: 0.49 + 3 x 0.01 = 0.52. Effective holdings 1 / 0.52 = 1.9.
- 0:42How to read it. Here 22 holdings count like about 17 equal ones.
- 1:02Watch out. Watch out: It counts positions, not how they move together: two similar stocks still count as two. On a portfolio the shares leave cash out; Cash share shows it on its own. On a multi asset portfolio an ETF can be the largest position.
Terms in this tutorial
- HerfindahlA concentration score: each position's share squared, all added up.
- Cash shareThe part of a portfolio sitting in cash rather than in stocks.
- Position sizesHow the money is spread across the stocks held.
- diversificationSpreading capital across assets that do not move together.