Where it is
ScreenHistory tab, Trade bookAdvanced
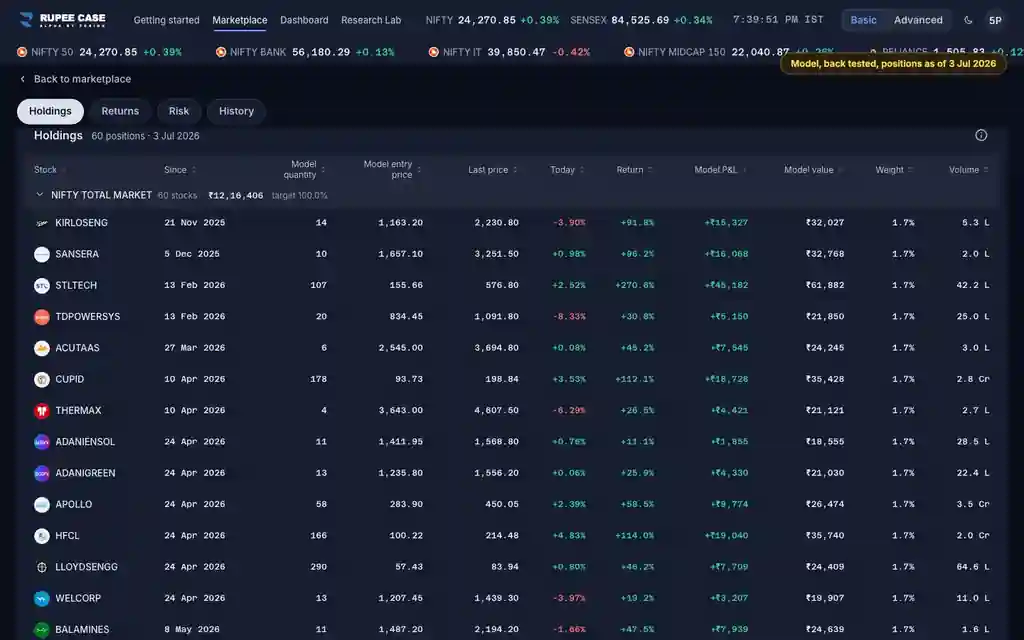
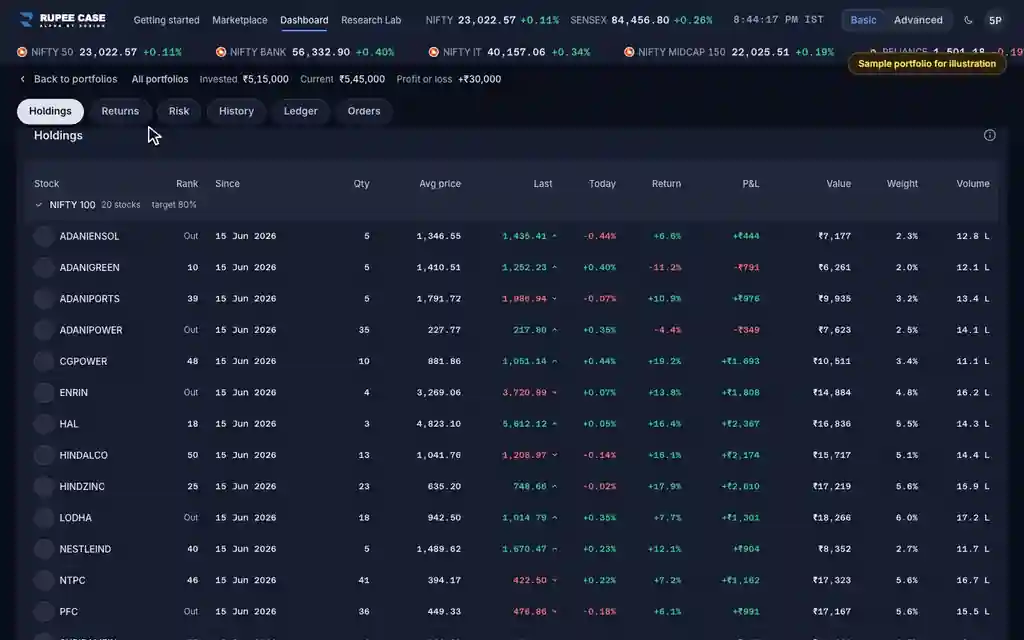
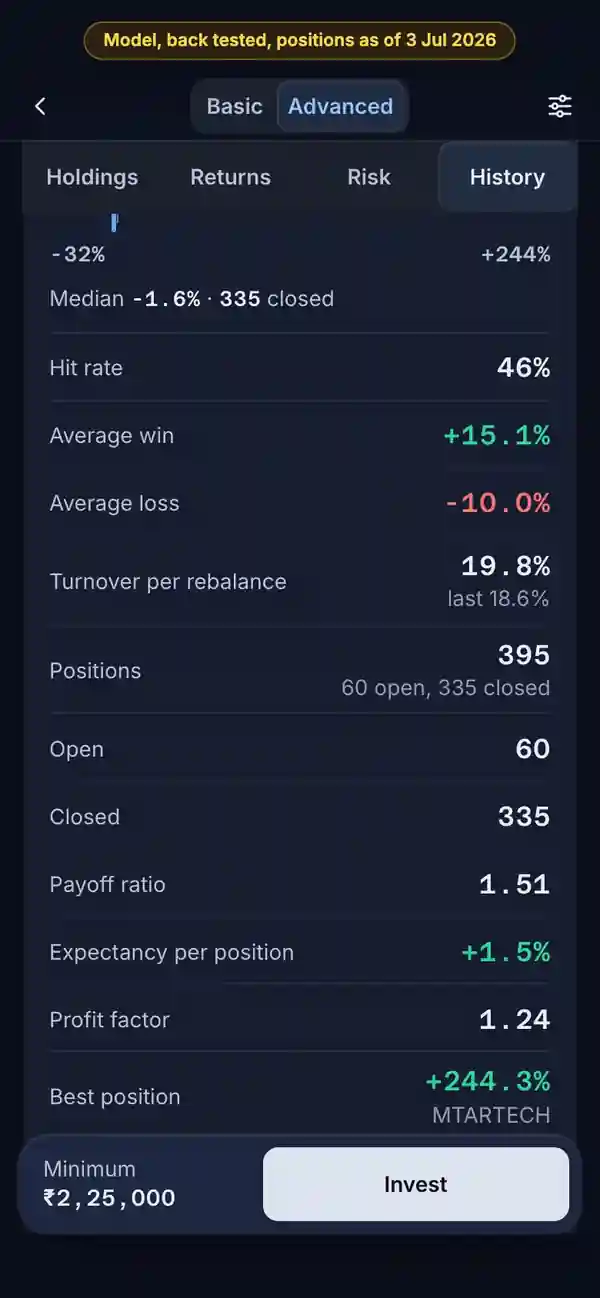
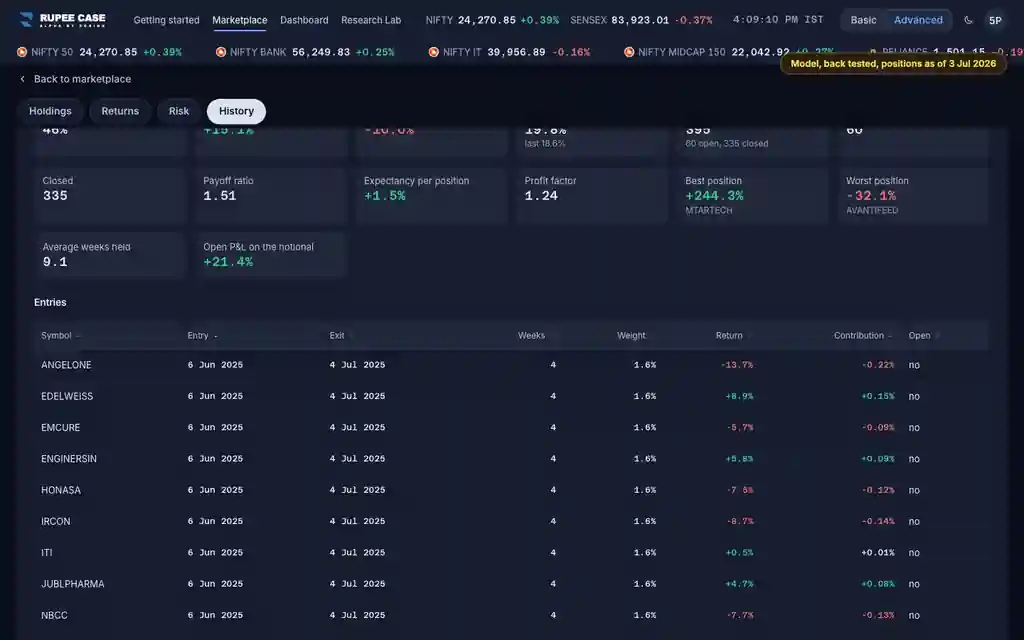
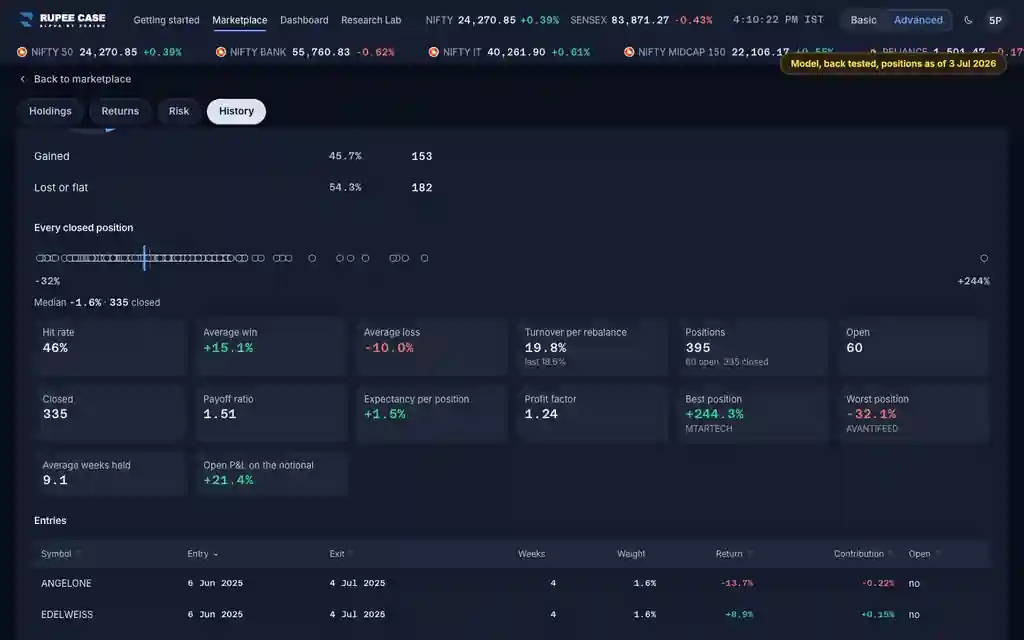
The History tab, Trade book card, in Advanced (strategy page). On a portfolio, the History tab's Model trade book: the strategy's positions opened since you invested, not your own trades.
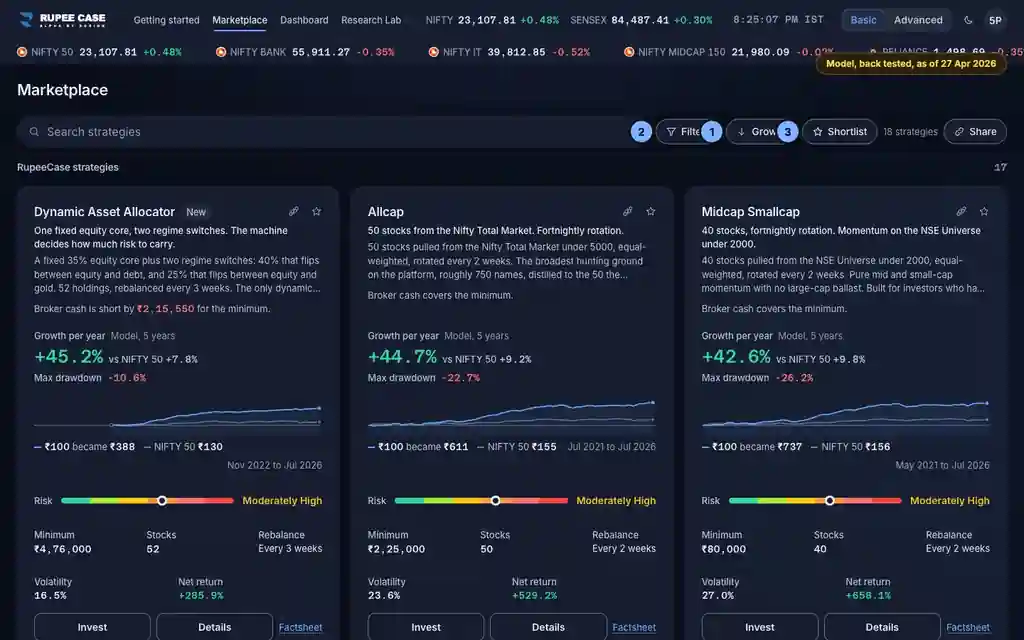
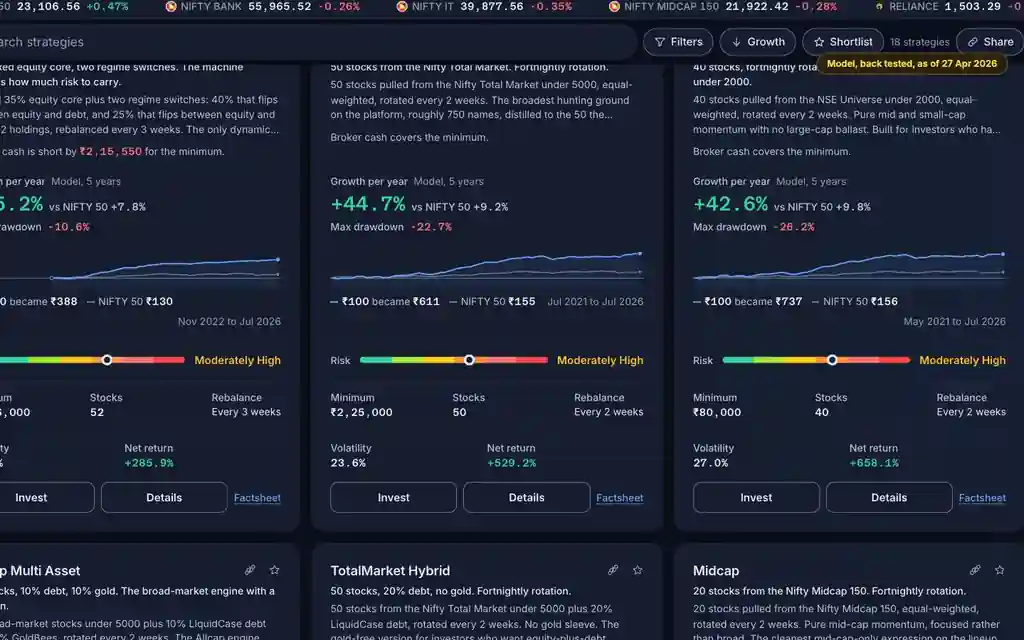
Index in this video: Allcap (strategy page).
What it means
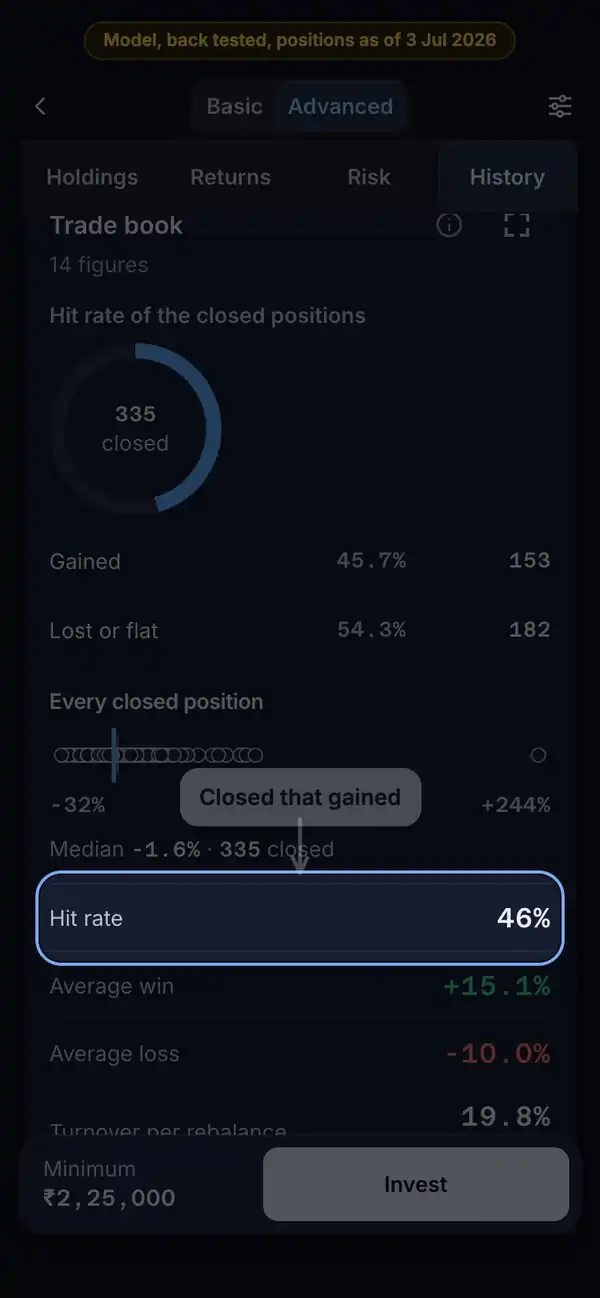
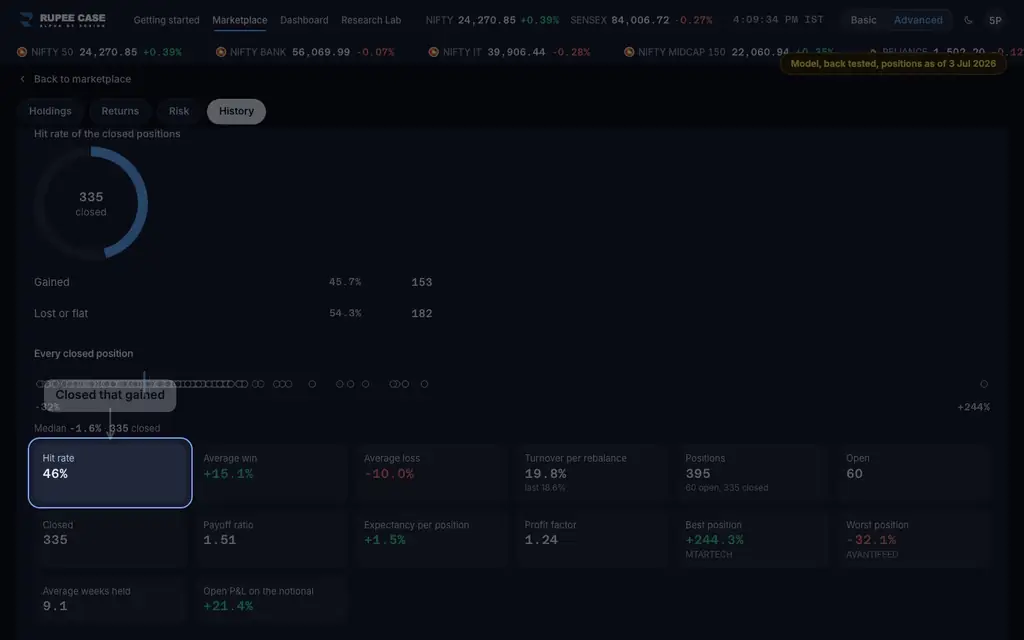
Each position the model opened counts as a trade: open until a rebalance sells it, closed after. Hit rate is the share of closed positions that gained. Average win and Average loss are the mean returns of the winners and of the losers; Payoff ratio divides one by the other. Expectancy per position combines them: what one position returned on average. Profit factor weighs each closed position by its size: gains over losses. Open P&L on the notional adds the open positions' weight times return, as a percent of the model's Rs 10,00,000.
The formula
The hit rate times the average win, plus the miss rate times the average loss, is the expectancy of one position.
Hit rate = closed positions above 0 / closed positions (flat counts as a miss)
Payoff ratio = average win / size of the average loss
Expectancy = hit rate x average win + (1 - hit rate) x average loss
Profit factor = sum of weight x return over gains / size of the same over losses
Open P&L on the notional = sum of weight x return over open positions
Worked example
Example only
- 10 closed positions: 4 gained +15% on average, 6 lost -5%
- Hit rate 40%; payoff 15 / 5 = 3.0
- Expectancy 0.4 x 15 + 0.6 x (-5) = +3% a position
How to read it
- A hit rate under 50% can still give a positive expectancy when the wins are larger.
- Profit factor above 1: closed gains outweighed closed losses, by size.
- Best and worst position name the extremes; Average weeks held gives the pace.
Watch out
- Each position's return runs from its entry price to its exit price.
- On a portfolio it is the model's book since you invested, not your own fills.
- The positions are the model's, at a weight of the notional, not live holdings.
Transcript
Tap Sound on for voice and music. These are the captions of the video, chapter by chapter.
- 0:00Where it is. In Advanced, History holds the model's trade book.
- 0:08What it means. Hit rate: the share of closed positions that gained.
- 0:40Worked example. Worked example, example only: 10 closed positions: 4 gained +15% on average, 6 lost -5%. Hit rate 40%; payoff 15 / 5 = 3.0. Expectancy 0.4 x 15 + 0.6 x (-5) = +3% a position.
- 0:46How to read it. Open P&L on the notional: the open positions, on the model's Rs 10,00,000.
- 1:02Watch out. Watch out: Each position's return runs from its entry price to its exit price. On a portfolio it is the model's book since you invested, not your own fills. The positions are the model's, at a weight of the notional, not live holdings.
Terms in this tutorial
- Hit rateThe share of closed positions that made money.
- Average win and average lossThe mean return of the closed positions that gained, and of those that lost.
- Expectancy per positionThe return one position made on average, once wins and losses are weighed by how often each happened.
- Profit factorEverything the winning positions made divided by everything the losing ones lost.
- Best and worst positionThe single closed position with the highest return and the one with the lowest.
- Open P&L on the notionalThe gain or loss on the positions the model still holds, worked out on its pretend ₹10,00,000 rather than on real money.
- Trade bookThe record of every position the model opened and closed, with its entry, exit and return.