




You have spent Path 2 learning to read a back test. Now the harder step: the number on a strategy page is not the number in your account. They answer different questions, and mixing them up is the quickest way to feel cheated by a strategy that is working as designed.
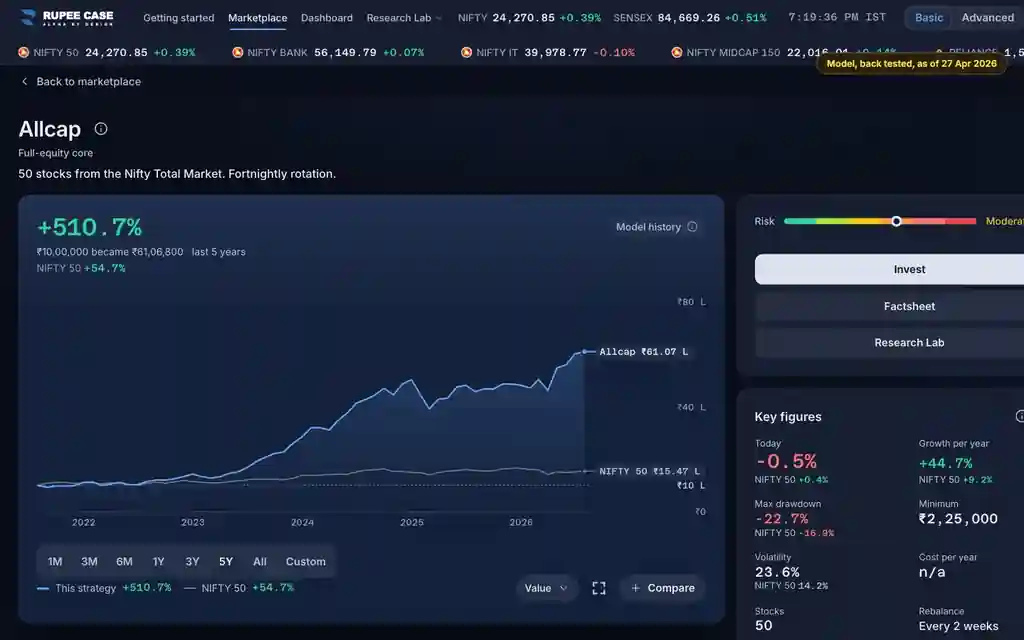
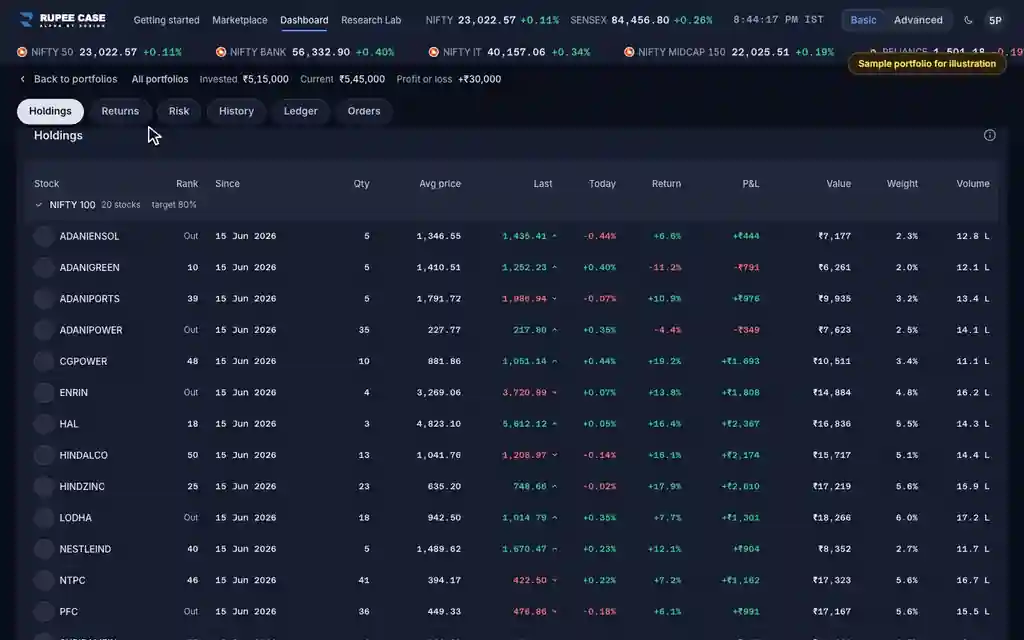
A strategy page shows model history: the rules run over past prices, after estimated charges, as if a notional ₹10,00,000 had followed them week by week. Your portfolio starts the day you invest. Nothing before that day belongs to you.
Model history
- A back test of the rules on past prices
- Starts at the first week of the window, not on your date
- Estimated charges, no fills, no timing, no top ups
- Tagged "Model history"
Your own money
- Your holdings at live prices, plus cash
- Starts the day you invest
- Your fills, your charges, your top ups and withdrawals
- Shown on the Dashboard
3By the end you can
- Tell a model history figure from your own portfolio figure, and Practice from Live.
- Work out Invested, Profit or loss and Return on net invested after a top up or withdrawal.
- Say when to quote the time weighted return and when XIRR.
3 terms this section turns on
Same model, different start dates
Take the Allcap model. Over the window that begins in July 2021 it multiplied about six times. That is a true fact about the model. It is also a fact about nobody who started in December 2024, the month of its 2024 high.
Allcap model, month end values rebased to 100 in July 2021, reached about 610 by July 2026. The same model started at 100 on 31 Dec 2024 fell to 77.9 by Feb 2025 and stood at 121.1 on 31 Jul 2026.
Month end model values from the RupeeCase Allcap nav file, Jul 2021 to 31 Jul 2026. Model, back tested, before your own fills and tax. Not client returns.
Read one more paragraph, 47 words
Same rules, same stocks, same weeks. One line says six times. The other says a 22.1% fall by the end of February 2025 and a gain of 21.1% by 31 July 2026. The model is not lying in either case. The question each line answers is different.
Practice and Live: which one did you press?
The invest sheet has two trading modes. Practice follows the strategy with no real broker order. Live places real orders in your own broker account, after your consent, during NSE trading hours. On an account that has Practice, the sheet opens on Practice. Press Invest now without looking and you have a practice portfolio, not a position.
- Check the modeThe sheet shows Practice or Live before you confirm.
- Practice firstWatch a portfolio follow the rules. No order, no money.
- Live when readyNeeds a broker session and your consent tick.
- Read the tabDashboard tabs: All, Live, Practice, Archived.
Read one more paragraph, 50 words
Practice is useful and honest about what it is not. It has no real fills, no slippage and no partial orders, so it tracks the model more closely than a Live portfolio will. Treat it as a rehearsal of the process, which Module 5.5 and Module 10.4 come back to.
Net invested and your return
The Dashboard keeps three numbers that people read too fast.
Because Invested falls when you withdraw, this return can jump after a withdrawal. Try it below. Add ₹2,00,000, let it grow to ₹3,00,000, take out ₹1,50,000, and the Return reads 200% on the ₹50,000 still counted as invested. The model never earned 200%. The arithmetic is correct and the label is easy to misread.

Top up and withdraw are proportional
A top up adds money and buys the current holdings in proportion to their weights. It does not rebalance, and nothing is sold. A partial withdrawal does the reverse: the app sells about the same share of every holding, roughly the amount over the current value. Take out ₹60,000 from ₹3,00,000 and about 20% of each stock goes. Choose Everything and all of it goes.
Read one more paragraph, 77 words
Two things follow. The mix you hold stays the mix the strategy chose, and every withdrawal is a sale, so it can bring charges and capital gains tax. Under the Income-tax Act, 2025, gains on listed shares held 12 months or less are taxed at 20%, and gains on shares held more than 12 months at 12.5% above ₹1.25 lakh a year, as of 16 Oct 2026. The money lands in your broker account, not your bank.
Your return three ways
Money that moves in and out makes "my return" ambiguous. There are three honest answers, and each is right for one question.
- On net invested. Profit or loss over net invested money. Simple, live, not a yearly rate.
- Time weighted. Strips out the cash flows and measures how the holdings did. It is how you compare a portfolio with an index. SEBI requires portfolio managers to report performance this way.
- Money weighted, or XIRR. A yearly rate that weighs when each rupee went in or came out. It is your own experience. The app shows it in Advanced, once the portfolio is 30 days old.
Here they are for one tracked example. A person follows the Allcap model: ₹2,00,000 on 31 Jan 2024, a ₹1,00,000 top up on 31 Jan 2025, a ₹1,00,000 withdrawal on 30 Jun 2025, valued on 31 Jul 2026 at model values, before charges and tax.
₹100 in Allcap Multi Asset became about ₹598 in the model
Return on net invested and time weighted are totals over 912 days; the other two are yearly
- On net invested, total96.2%
- Time weighted, total90.5%
- Time weighted, per year29.4%
- Money weighted (XIRR), per year29.0%
Computed by RupeeCase from Allcap month end model values on 31 Jan 2024, 31 Jan 2025, 30 Jun 2025 and 31 Jul 2026 (330.08, 456.54, 497.16, 628.96). Model, back tested, before charges and tax. An illustration, not a client.
Read one more paragraph, 53 words
The first two differ by 5.7 points because the top up went in after a run and the withdrawal came out before a rise. Only the time weighted figure is comparable with the model's own 90.5%. Only XIRR says what this person's timing earned. Neither is wrong. Ask which question you are asking.
Model since you invested
Open a portfolio and the Returns and Risk tabs keep the same names as on a strategy page. Most cards there are not yours. They are the linked strategy's model, cut to start on your invest date, and each carries the tag "Model since you invested" with a band reading "not your portfolio". The Contribution card and your Ledger are yours. The model never shows history from before the day you invested.
Some tiles stay empty at first, with a reason such as "After a full month invested" or "After a year invested". They are not broken. A window cannot be filled before it exists.
What would you do?
Three months in, your portfolio is up 3%. The strategy page shows a model gain of 80% over its window. You feel behind.
- Conclude the portfolio is broken
You compared a back test window with a three month life. The model since your invest date is the fair yardstick, and your own charges and fills sit between the two.
- Compare with the model since you invested
That card uses your start date, so the gap shows your timing, fills, charges and top ups rather than five years of history you were not there for.
Illustrative figures, not a client or a real date.
MythThe big percentage on a strategy page is what an investor in it earned.
FactIt is model history from the first week of its window. What you earn starts on your own day, after your own charges, and depends on what you add and take out.
Rule of thumb. Before you read any figure on a portfolio page, find the word Model or the word Live next to it. Then find the start date. Then read the number.
Key takeaways
- Model history is a back test; your portfolio starts the day you invest.
- The invest sheet opens on Practice, which places no order.
- Invested is money added less money taken out, so a withdrawal can make Return jump.
- Top ups and partial withdrawals buy and sell every holding in proportion.
- Time weighted return compares with an index; XIRR measures your own timing.
How this shows up in RupeeCase
The strategy page leads with the tag "Model history". The Dashboard shows your actual investment from the date you invested: Current value, Invested, Profit or loss, Return and the same money in the benchmark. That last line grows each amount you put in or took out by the index from its own date, so the comparison copies your timing. Inside a portfolio, the Ledger tab lists Money in, Money out and Net money in, and the Compare card carries the time weighted return. Money weighted return per year sits in Advanced. The price index used as benchmark has no costs, and your portfolio does. The tutorials Model history or your portfolio, Model cards on a portfolio, Same money in NIFTY 50, Your return three ways, Top up and Withdraw show each screen.
Two terms to hold on to from 2.6
Questions readers ask
Is a Practice portfolio real money?
No. Practice places no order at a broker and has no real fills, so nothing is bought or sold for you. It shows how a portfolio would follow the strategy. Live is the mode that sends real orders to your own broker account.
Why is my Return different from the strategy's gain?
Different start date, your own charges and fills, top ups and withdrawals, and the fact that Return is measured on net invested money. The "Model since you invested" cards give the closest like for like comparison.
Which return should I quote when I describe my result?
Say which one. The time weighted figure compares fairly with an index or the model. XIRR tells you what your own timing earned, as a yearly rate. Return on net invested is a simple live total and is not a yearly figure.
Rules and figures in this module were last verified on 19 Oct 2026. Tax and regulatory rules change; check the source before acting.